Live Update: Internet Explorer 6
|
Some members have reported that earlier versions of
Internet Explorer interfere with the Live Update. If you
experience a timeout error during the Live Update, update
to Internet Explorer 6 at
Microsoft Download. There are further Internet Explorer issues that Microsoft will address in their next update. (more) |
Trading Diary
February 6, 2004
These extracts from my daily trading diary are
for educational purposes and should not be interpreted as
investment advice. Full terms and conditions can be found at
Terms
of Use .
USA
The Dow Industrial Average rallied to close at 10593, just below
resistance. The strong close and low volume give conflicting
signals. A rise above 10600 would be bullish. A fall below last
Thursday's low of 10417 would signal a re-test of support at
10000.
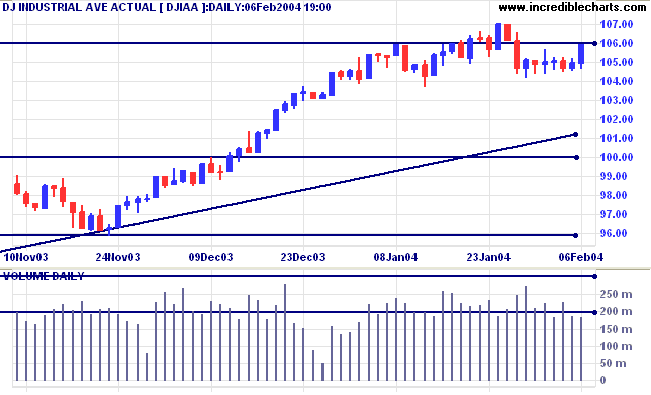
Twiggs Money Flow (100) continues to signal
accumulation.
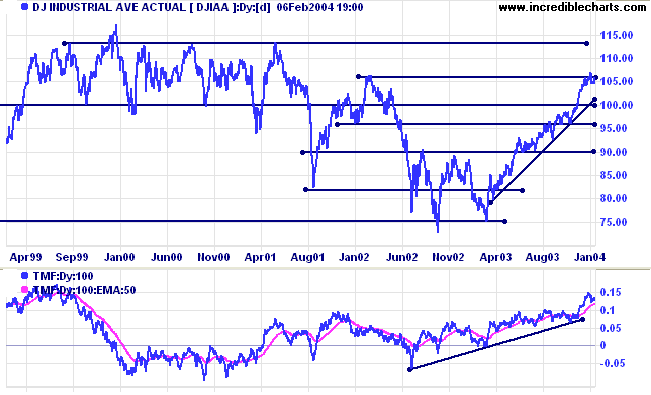
The primary trend is up. Resistance is at 10600 and 11300 to 11350. A fall below support at 9600 would signal reversal.
The primary trend is up. Resistance is at 10600 and 11300 to 11350. A fall below support at 9600 would signal reversal.
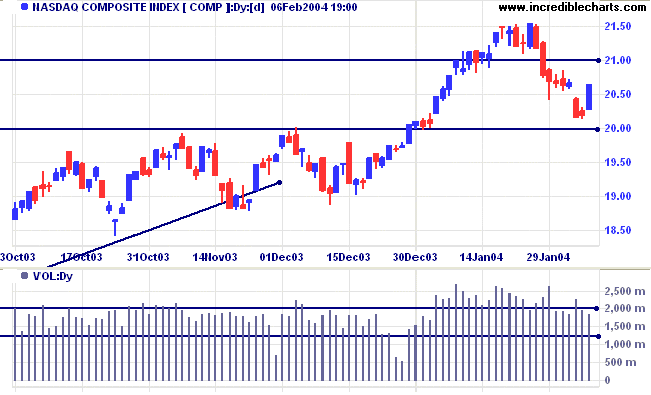
The Nasdaq Composite rallied strongly to 2064, closing the gap
from earlier in the week.
The intermediate trend is down. Initial support is at 2000, resistance at 2100, 2150 and 2300 (May 2001).
The primary trend is up. A fall below support at 1640 would signal reversal.
The intermediate trend is down. Initial support is at 2000, resistance at 2100, 2150 and 2300 (May 2001).
The primary trend is up. A fall below support at 1640 would signal reversal.
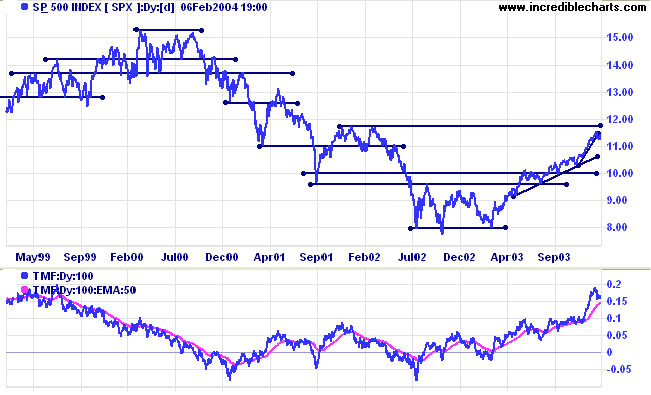
The S&P 500 rallied to test resistance, closing at 1142. The
strong close and lower volume give conflicting signals.
The intermediate trend is uncertain, with resistance overhead at 1155 and 1175.
Short-term: Bullish if the S&P500 is above 1155. Bearish below 1122, last Thursday's low.
The intermediate trend is uncertain, with resistance overhead at 1155 and 1175.
Short-term: Bullish if the S&P500 is above 1155. Bearish below 1122, last Thursday's low.
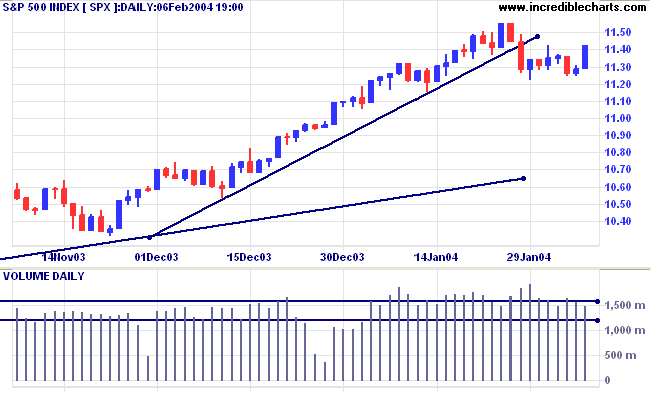
The primary trend is up. A fall below 960 would signal
reversal.
Twiggs Money Flow (100) may have turned down but continues to signal accumulation.
Intermediate: Bullish above 1155.
Long-term: Bullish above 1000.
Twiggs Money Flow (100) may have turned down but continues to signal accumulation.
Intermediate: Bullish above 1155.
Long-term: Bullish above 1000.
The Chartcraft NYSE Bullish % Indicator rallied
to 84.48%.
More than 80% of NYSE stocks are in an up-trend, the highest level in 10 years.
More than 80% of NYSE stocks are in an up-trend, the highest level in 10 years.
Unemployment lower
Non-farm payrolls grew by 112,000 in January, while unemployment fell to 5.6%, the lowest level in 2 years. (more)
Non-farm payrolls grew by 112,000 in January, while unemployment fell to 5.6%, the lowest level in 2 years. (more)
Treasury yields
The yield on 10-year treasury notes retreated to 4.089%, signaling weakness in the intermediate up- trend.
The primary trend is up. A close below the September low of 3.93% would signal reversal.
The yield on 10-year treasury notes retreated to 4.089%, signaling weakness in the intermediate up- trend.
The primary trend is up. A close below the September low of 3.93% would signal reversal.
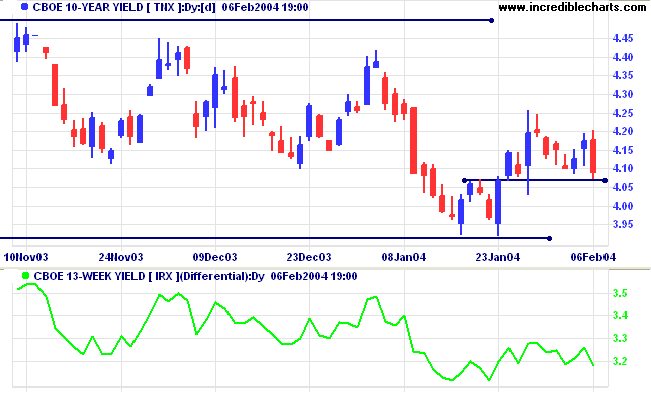
The
yield differential (10-year T-notes compared to 13-week
T-bills) is a healthy 3.2%.
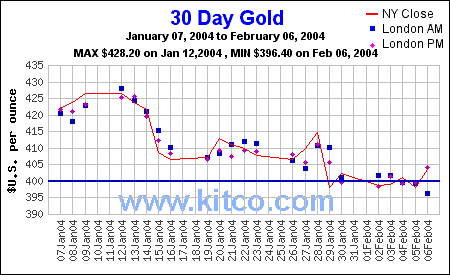
Gold
New York (13.00): Spot gold rallied to $403.20, after testing support at 400.
The intermediate trend is down.
The primary trend is up. A fall below $370 would signal reversal.
New York (13.00): Spot gold rallied to $403.20, after testing support at 400.
The intermediate trend is down.
The primary trend is up. A fall below $370 would signal reversal.
Subscribe to Incredible Charts Premium
Charting service with:
|
ASX Australia
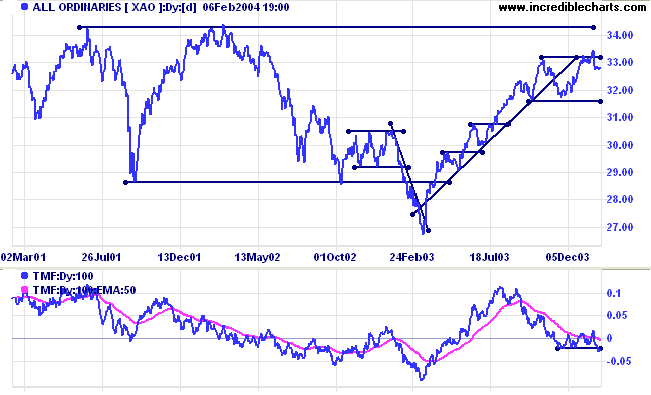
The All Ordinaries rallied to 3285. The index is still within the
consolidation pattern and lower volume signals a lack of
commitment from buyers. The intermediate trend is uncertain. A
follow-through above 3300 would be bullish. A fall below 3266
would signal commencement of a down-trend.
Short-term: Bullish above 3350. Bearish below 3266.
Short-term: Bullish above 3350. Bearish below 3266.
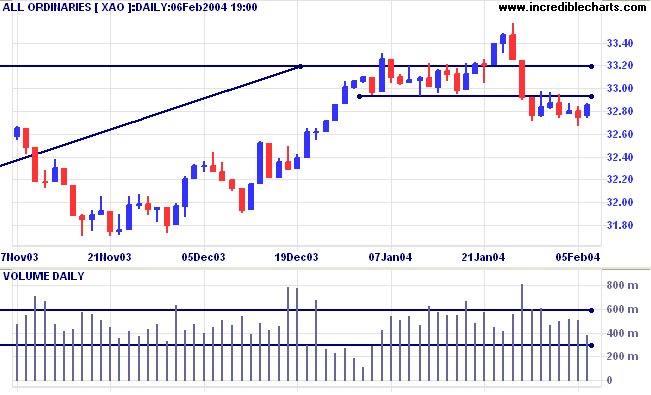
On the 3-year chart, the false break above resistance is a
bearish sign, increasing the likelihood of a test of support at
3160.
Twiggs Money Flow (100) has broken below its 3-month support level, another bearish sign.
The primary trend is up. A fall below 3160 (the October 1 low) would signal reversal.
Intermediate term: Bullish above 3350. Bearish below 3160.
Long-term: Bearish below 3160.
Twiggs Money Flow (100) has broken below its 3-month support level, another bearish sign.
The primary trend is up. A fall below 3160 (the October 1 low) would signal reversal.
Intermediate term: Bullish above 3350. Bearish below 3160.
Long-term: Bearish below 3160.
Sector Analysis
The 11 sectors (10 + Property) are in various market stages. Relative Strength (xjo) measures the performance of each sector relative to the overall index.
The 11 sectors (10 + Property) are in various market stages. Relative Strength (xjo) measures the performance of each sector relative to the overall index.
- Energy [XEJ] - stage 2 (RS is rising)
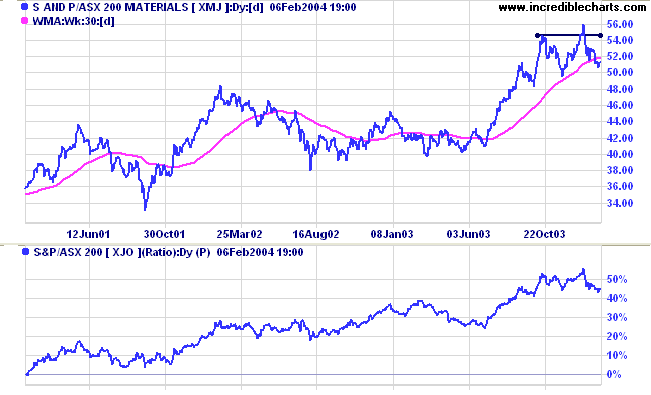
- Materials [XMJ] - stage 2 (RS is falling)
- Industrials [XNJ] - stage 2 (RS is rising)
- Consumer Discretionary [XDJ] - stage 3 (RS is falling)
- Consumer Staples [XSJ] - stage 3 (RS is level)
- Health Care [XHJ] - stage 1 (RS is rising)
- Property Trusts [XPJ] - stage 3 (RS is level).
- Financial excl. Property [XXJ] - stage 3 (RS is level)
- Information Technology [XIJ] - stage 2 (RS is falling)
- Telecom Services [XTJ] - stage 2 (RS is level)
- Utilities [XUJ] - stage 2 (RS is level)
Materials [XMJ] has made a false (marginal) break above
the previous high before retreating below the 30-week MA.
Relative Strength (price ratio: xjo) has fallen below the
previous trough. These may be the first signs of a stage 3 top.
Sectors: Relative Strength
A stock screen of the ASX 200 using % Price Move (1 month: +5%) fell to 21 stocks, from 50 two weeks ago. The highest reading was 131 on April 11, 2003 and the lowest, 8 on March 14, 2003. Prominent sectors are:
A stock screen of the ASX 200 using % Price Move (1 month: +5%) fell to 21 stocks, from 50 two weeks ago. The highest reading was 131 on April 11, 2003 and the lowest, 8 on March 14, 2003. Prominent sectors are:
- Casinos & Gaming (3)
About
the Trading Diary has been expanded to offer further
assistance to readers, including directions on how to search the
archives.
Colin Twiggs
We're so busy watching out for what's just ahead of us,
that we don't take the time to enjoy where we are.
Days go by and we hardly notice them. Life becomes a blur.
Often, it takes some calamity to make us live in the present.
Then suddenly we wake up and see all the mistakes we've made.
But it's too late to change anything.
~ Calvin & Hobbes.
that we don't take the time to enjoy where we are.
Days go by and we hardly notice them. Life becomes a blur.
Often, it takes some calamity to make us live in the present.
Then suddenly we wake up and see all the mistakes we've made.
But it's too late to change anything.
~ Calvin & Hobbes.
|
Subscribe as a Premium Member and receive:
|
for only $270 (AUD)
per
year
Back Issues
You can now view back issues at the Daily Trading Diary Archives.
You can now view back issues at the Daily Trading Diary Archives.
Back Issues
Access the Trading Diary Archives.