
We wish our readers peace and goodwill over Christmas
and prosperity in the year ahead.
Trading Diary
December 19, 2003
These extracts from my daily trading diary are
for educational purposes and should not be interpreted as
investment advice. Full terms and conditions can be found at
Terms
of Use .
USA
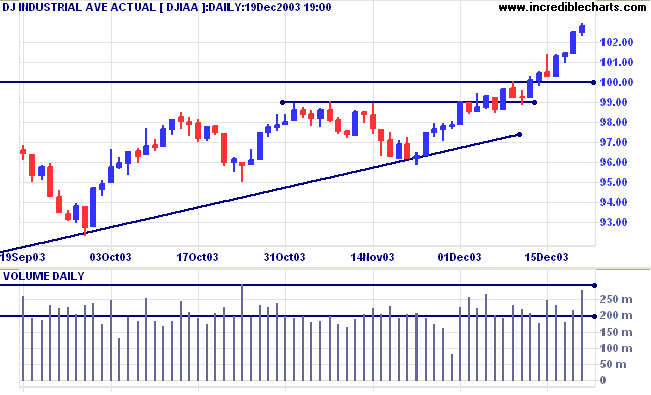
The Dow Industrial Average has surged above the 10000 level,
closing at 10278 on higher volume.
The intermediate trend is up.
The primary trend is up. A fall below support at 9000 will signal reversal.
The intermediate trend is up.
The primary trend is up. A fall below support at 9000 will signal reversal.
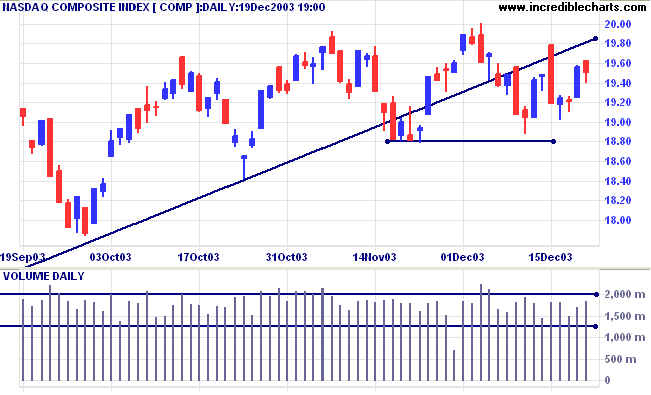
The Nasdaq Composite closed down at 1951 on higher volume.
The intermediate trend is uncertain. Resistance is at 2000. A fall below 1880 will complete a double top reversal with a target of 1760: 1880-(2000-1880).
The primary trend is up. A fall below support at 1640 will signal reversal.
The intermediate trend is uncertain. Resistance is at 2000. A fall below 1880 will complete a double top reversal with a target of 1760: 1880-(2000-1880).
The primary trend is up. A fall below support at 1640 will signal reversal.
The S&P 500 paused at 1088. Strong volume and a narrow range
signal increased selling pressure.
The intermediate trend is up.
Short-term: Bullish if the S&P500 is above resistance at 1090. Bearish below 1053 (the December 10 low).
The intermediate trend is up.
Short-term: Bullish if the S&P500 is above resistance at 1090. Bearish below 1053 (the December 10 low).
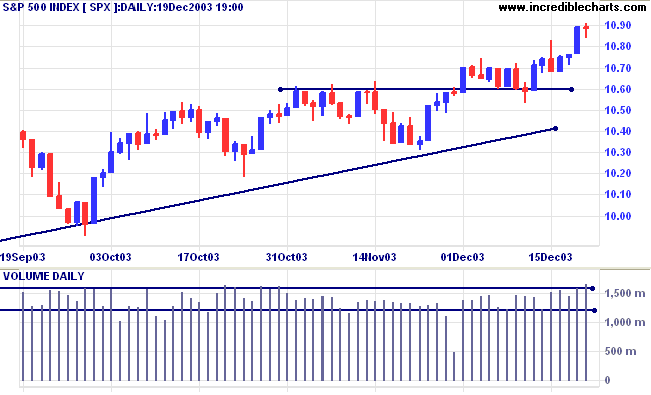
The primary trend is up. A fall below 960 will signal
reversal.
Intermediate: Bullish above 1090.
Long-term: Bullish above 960.
Intermediate: Bullish above 1090.
Long-term: Bullish above 960.
The Chartcraft NYSE Bullish % Indicator is at a
10-year high of 82.61% (December 19).
Jobless claims fall
New unemployment claims fell to 353,000 last week, while total unemployment is at 5.9%, down from the peak of 6.4%. (more)
New unemployment claims fell to 353,000 last week, while total unemployment is at 5.9%, down from the peak of 6.4%. (more)
Why is money supply growth slowing?
Some economists dismiss the figures as insignificant, while others are concerned. (more)
Some economists dismiss the figures as insignificant, while others are concerned. (more)
US Stock Screens
A new version of Incredible Charts will be released early next week,
with stock screens covering the US and Australian markets.
Adjusted end-of-day charts for NYSE, Nasdaq, Amex, US indexes
are accessible from the free version Securities menu until early 2004.
A new version of Incredible Charts will be released early next week,
with stock screens covering the US and Australian markets.
Adjusted end-of-day charts for NYSE, Nasdaq, Amex, US indexes
are accessible from the free version Securities menu until early 2004.
Treasury yields
The yield on 10-year treasury notes has eased to 4.13%.
The intermediate trend is uncertain.
The primary trend is up.
The yield on 10-year treasury notes has eased to 4.13%.
The intermediate trend is uncertain.
The primary trend is up.
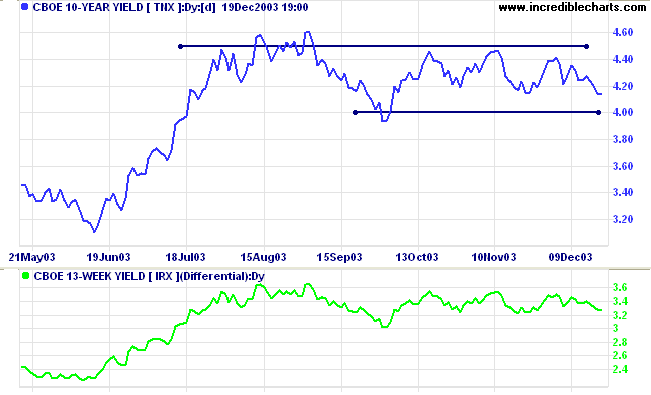
The
yield differential (10-year T-notes compared to 13-week
T-bills) is a healthy 3.3%.
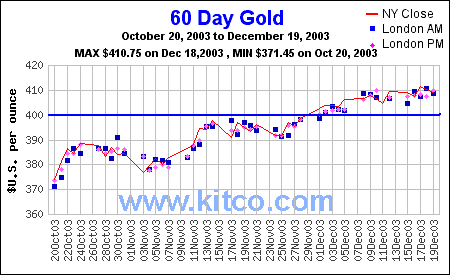
Gold
New York (13.30): Spot gold eased to $408.70 after reaching 413 mid-week.
The intermediate trend is up.
The primary trend is up. Expect support at 400, resistance at 415 (the 10-year high).
New York (13.30): Spot gold eased to $408.70 after reaching 413 mid-week.
The intermediate trend is up.
The primary trend is up. Expect support at 400, resistance at 415 (the 10-year high).
Subscribe to Incredible Charts Premium
version with:
|
ASX Australia
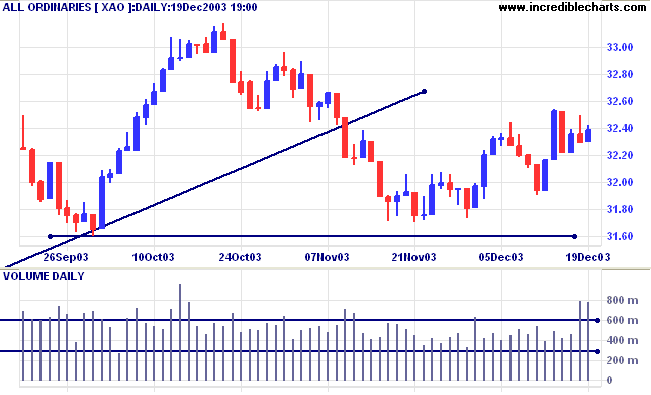
The All Ordinaries closed up 9 points at 3238.
Normally a consolidation is accompanied by declining volume. High
volume and a narrow range signal commitment from both buyers and
sellers -- a real tussle is developing.
MACD (26,12,9) is above its signal line; Slow
Stochastic (20,3,3) has whipsawed above.
Short-term: Bullish above 3253, Monday's high. Bearish below 3220 (Tuesday's low).
Short-term: Bullish above 3253, Monday's high. Bearish below 3220 (Tuesday's low).
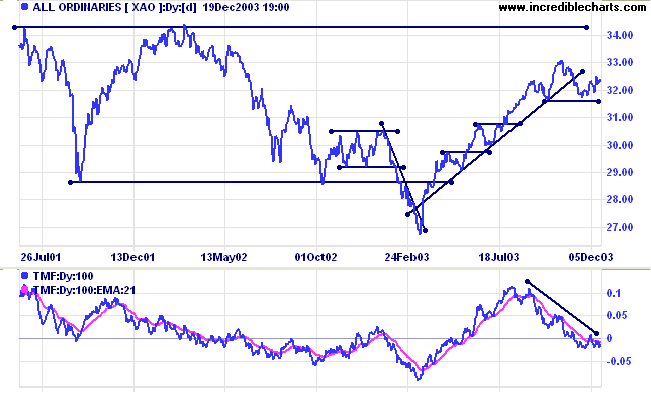
The All Ords is below its long-term trendline,
signaling weakness. The primary trend is up but will reverse if
there is a fall below 3160 (the October 1 low). A fall below 3160
would also complete a head and shoulders reversal with a target
of 3010: 3160-(3310-3160)
Twiggs Money Flow (100) is below its signal line, indicating distribution, after a bearish triple divergence.
Intermediate term: Bullish above 3253. Bearish below 3160.
Long-term: Bearish below 3160.
Twiggs Money Flow (100) is below its signal line, indicating distribution, after a bearish triple divergence.
Intermediate term: Bullish above 3253. Bearish below 3160.
Long-term: Bearish below 3160.
Sector Analysis
The 11 sectors (10 + Property) are in various market stages. Relative Strength (xjo) measures the performance of each sector relative to the overall index.
The 11 sectors (10 + Property) are in various market stages. Relative Strength (xjo) measures the performance of each sector relative to the overall index.
- Energy [XEJ] - stage 2 (RS is rising)
- Materials [XMJ] - stage 2 (RS is rising)
- Industrials [XNJ] - stage 2 (RS is rising)
- Consumer Discretionary [XDJ] - stage 3 (RS is falling)
- Consumer Staples [XSJ] - stage 1 (RS is level)
- Health Care [XHJ] - stage 1 (RS is falling)
- Property Trusts [XPJ] - stage 3 (RS is rising).
- Financial excl. Property [XXJ] - stage 4** (RS is falling)
- Information Technology [XIJ] - stage 2 (RS is rising)
- Telecom Services [XTJ] - stage 2 (RS is falling)
- Utilities [XUJ] - stage 3 (RS is level)
** Financial-x-Property Trusts [XXJ]
formed a narrow line (or trading range) over the past 5 months.
The index broke below the 3933 support level at [7], signaling a
primary trend reversal, but has subsequently retreated back
within the pattern. This is a weak signal. However, Relative
Strength (xjo) is falling and I will treat the primary trend as
downwards until there is clear evidence to the contrary.
The intermediate trend will reverse up if the index rises above
the recent high of 4026. A rise above 4136 will signal that the
primary trend has turned upwards.
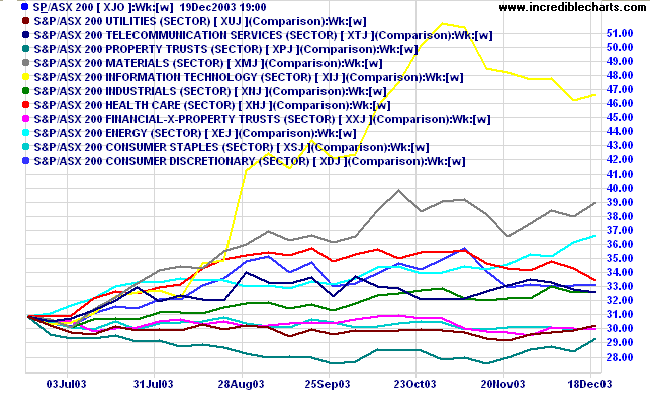
Sector Comparison
The 6-month sector comparison shows Information Technology [XIJ] retreating after a heady climb. Energy [XEJ] looks promising, while Property [XPJ] is starting to recover.
The 6-month sector comparison shows Information Technology [XIJ] retreating after a heady climb. Energy [XEJ] looks promising, while Property [XPJ] is starting to recover.
Sectors: Relative Strength
A stock screen of the ASX 200 using % Price Move (1 month: +5%) recovered to 50 stocks (compared to 131 on April 11, 2003; and 8 on March 14, 2003). Prominent sectors are:
A stock screen of the ASX 200 using % Price Move (1 month: +5%) recovered to 50 stocks (compared to 131 on April 11, 2003; and 8 on March 14, 2003). Prominent sectors are:
- Real Estate Investment Trusts (12)
- Diversified Metals & Mining (4)
- Oil & Gas Exploration & Production (3)
- Broadcasting & Cable TV (3).
Daily Trading Diary
Stocks analyzed during the week were:
Stocks analyzed during the week were:
- ERG Limited - ERG
- Foodland - FOA
Understanding
the Trading Diary has been expanded to offer further
assistance to readers, including directions on how to search the
archives.
Colin Twiggs
For everything there is a season,
And a time for every matter under heaven:
A time to be born, and a time to die;
A time to plant, and a time to pluck up what is planted;
A time to kill, and a time to heal;
A time to break down, and a time to build up;
A time to weep, and a time to laugh;
A time to mourn, and a time to dance;
A time to throw away stones, and a time to gather stones together;
A time to embrace, And a time to refrain from embracing;
A time to seek, and a time to lose;
A time to keep, and a time to throw away;
A time to tear, and a time to sew;
A time to keep silence, and a time to speak;
A time to love, and a time to hate,
A time for war, and a time for peace.
- Ecclesiastes 3:1-8
Daily Trading Diary
The Daily Trading Diary will resume on January 5th 2004,
after the Christmas break.
The Daily Trading Diary will resume on January 5th 2004,
after the Christmas break.
Back Issues
You can now view back issues at the Daily Trading Diary Archives.
You can now view back issues at the Daily Trading Diary Archives.
Back Issues
Access the Trading Diary Archives.