
Trading Diary
November 14, 2003
These extracts from my daily trading diary are
for educational purposes and should not be interpreted as
investment advice. Full terms and conditions can be found at
Terms
of Use .
USA
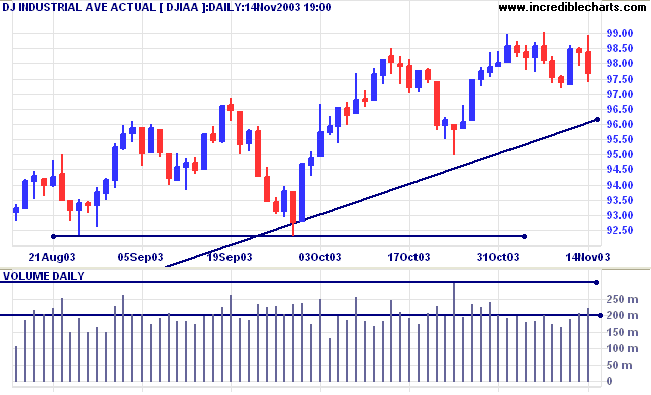
The Dow Industrial Average retreated to 9769 on higher volume,
after again testing resistance at 9900.
The intermediate trend is down.
The primary trend is up. A fall below 9000 will signal reversal.
The intermediate trend is down.
The primary trend is up. A fall below 9000 will signal reversal.
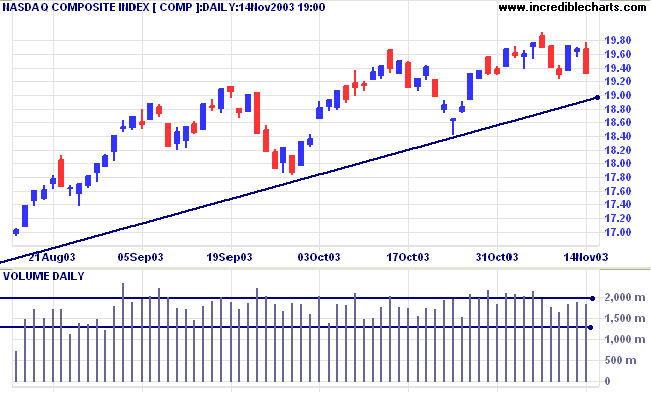
The Nasdaq Composite fell 37 points to 1930 on average
volume.
The intermediate trend is up. Expect resistance at 2000 and 2100, the January 2002 high.
The primary trend is up. A fall below 1640 will signal reversal.
The intermediate trend is up. Expect resistance at 2000 and 2100, the January 2002 high.
The primary trend is up. A fall below 1640 will signal reversal.
The S&P 500 closed down at 1050 on average volume, after
testing resistance at 1062.
The intermediate trend is up. Expect further resistance at 1100 (a former 2002 support level).
Short-term: Bullish if the S&P500 is above 1062. Bearish below 1043 (Tuesday's low).
The intermediate trend is up. Expect further resistance at 1100 (a former 2002 support level).
Short-term: Bullish if the S&P500 is above 1062. Bearish below 1043 (Tuesday's low).
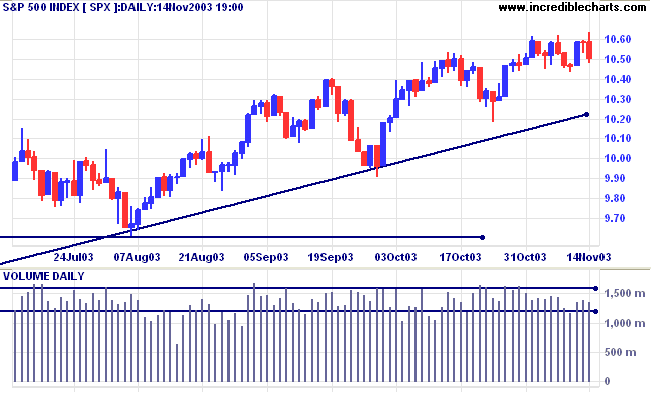
The primary trend is up. A fall below 960 will signal
reversal.
Twiggs Money Flow (100) continues to signal accumulation.
Intermediate: Bullish above 1062.
Long-term: Bullish above 960.
Twiggs Money Flow (100) continues to signal accumulation.
Intermediate: Bullish above 1062.
Long-term: Bullish above 960.
The Chartcraft NYSE Bullish % Indicator is up
slightly at 81.24% (November 14).
A 3-box reversal would signal a bear alert.
A 3-box reversal would signal a bear alert.
Retail sales fall
Retail sales fell 0.3% in October, after a 0.4% fall in September, while consumer confidence rises. (more)
Retail sales fell 0.3% in October, after a 0.4% fall in September, while consumer confidence rises. (more)
Treasury yields
The yield on 10-year treasury notes has fallen to 4.23%.
The intermediate trend is up but equal highs, [2] and [3], below a higher peak [1] are a bear signal.
The primary trend is up.
The yield on 10-year treasury notes has fallen to 4.23%.
The intermediate trend is up but equal highs, [2] and [3], below a higher peak [1] are a bear signal.
The primary trend is up.
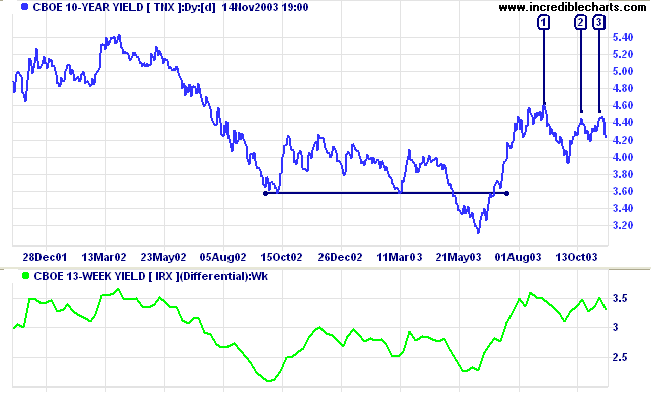
The
yield differential is a healthy 3.3% (10-year T-notes
compared to 13-week T-bills).
Gold
New York (13.30): Spot gold rallied to close the week at $397.30.
The intermediate trend is up.
The primary trend is up. Expect resistance at 400 to 415.
New York (13.30): Spot gold rallied to close the week at $397.30.
The intermediate trend is up.
The primary trend is up. Expect resistance at 400 to 415.
ASX Australia
The All Ordinaries is consolidating below resistance at 3238 to
3250 on declining volume, a bearish sign in a down-trend. The
index closed 15 points lower at 3215.
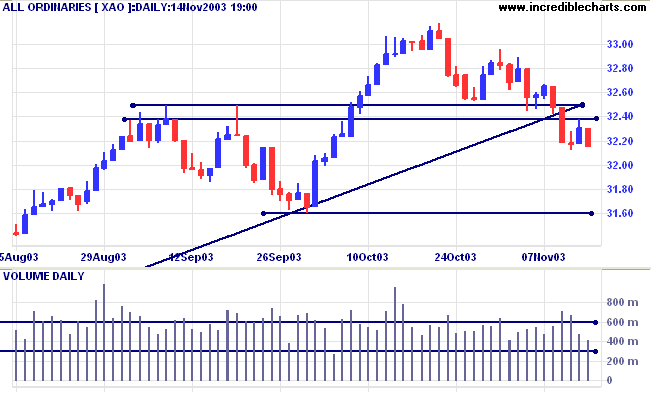
The intermediate trend is down with the index having broken
through support at 3238 to 3250.
MACD (26,12,9) is below its signal line; Slow Stochastic (20,3,3) has crossed above.
Short-term: Bullish if the All Ords crosses back above 3250. Bearish below 3238.
MACD (26,12,9) is below its signal line; Slow Stochastic (20,3,3) has crossed above.
Short-term: Bullish if the All Ords crosses back above 3250. Bearish below 3238.
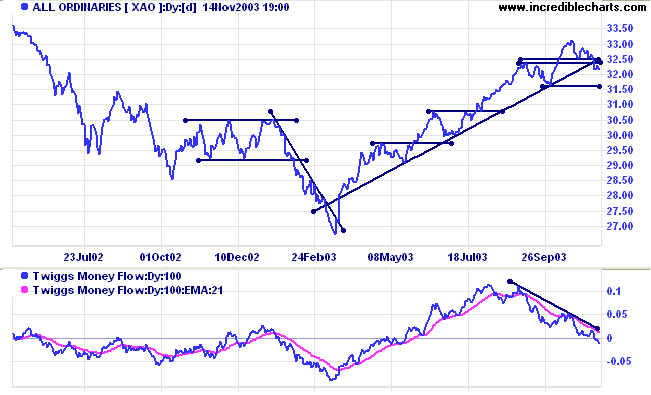
The rally is extended and probability of a reversal increases
with each successive primary trend movement. XAO has now
broken below the supporting trendline, signaling weakness. The
primary trend is up but will reverse if there is a fall below
3160 (the October 1 low).
Twiggs Money Flow (100) has crossed below zero after a bearish triple divergence, signaling distribution.
Intermediate term: Bullish above 3250. Bearish below 3160.
Long-term: Bearish below 3160.
Twiggs Money Flow (100) has crossed below zero after a bearish triple divergence, signaling distribution.
Intermediate term: Bullish above 3250. Bearish below 3160.
Long-term: Bearish below 3160.
Sector Analysis
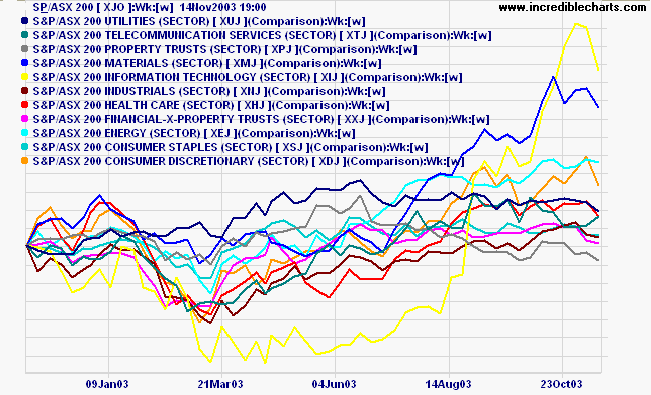
Materials, Consumer Discretionary and Information Technology are the most promising, with rising Relative Strength (xjo).
Materials, Consumer Discretionary and Information Technology are the most promising, with rising Relative Strength (xjo).
- Energy [XEJ] - stage 2 (RS is rising)
- Materials [XMJ] - stage 2 (RS is rising)
- Industrials [XNJ] - stage 2 (RS is level)
- Consumer Discretionary [XDJ] - stage 2 (RS is rising)
- Consumer Staples [XSJ] - stage 1 (RS is falling)
- Health Care [XHJ] - stage 2 (RS is level)
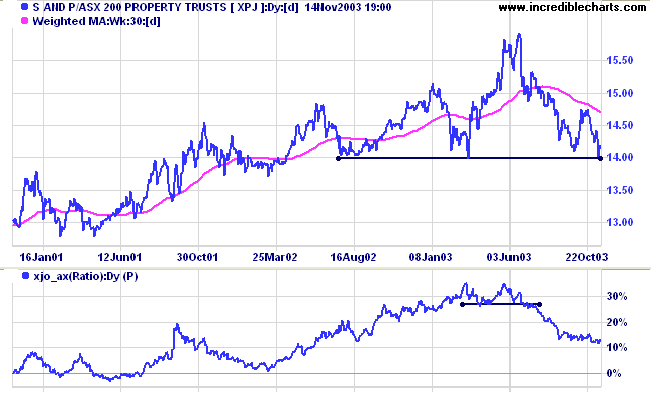
- Property Trusts [XPJ] - stage 3 (RS is falling). A fall below 1400 will signal the start of stage 4.
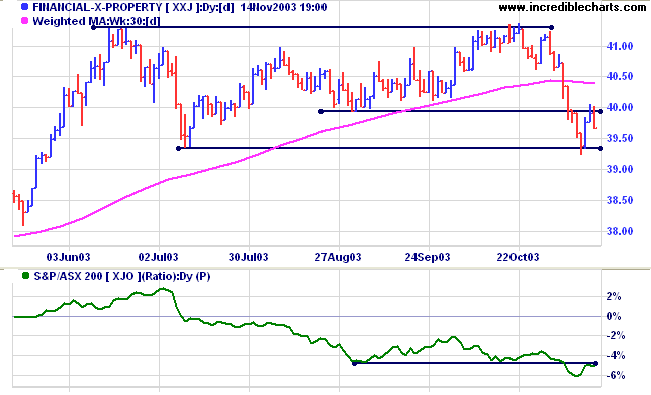
- Financial excl. Property [XXJ] - stage 3 (RS is falling)
- Information Technology [XIJ] - stage 2 (RS is rising)
- Telecom Services [XTJ] - uncertain (RS is falling)
- Utilities [XUJ] - stage 3 (RS is falling)
The 1-year sector
comparison chart shows Information Technology and Materials
rising steeply, followed by Energy, Consumer Staples and
Industrials at a more sedate pace. Utilities, Property Trusts and
Telecom are slipping, while Financials-x-Property and Health Care
are starting to weaken.
Property [XXJ] is testing support at 1400. A fall below this
level will signal the start of stage 4. Relative Strength (xjo)
is leveling out after a steep fall.
Financial-x-Property [XXJ] has successfully tested the new
resistance level at 3995. Consolidation between 3995 and 3934
will be a bearish sign, especially when accompanied by declining
Relative Strength (xjo).
Sectors: Relative Strength
A stock screen of the ASX 200 using % Price Move (1 month: +5%) fell sharply to 26 stocks (compared to 131 on April 11, 2003; and 8 on March 14, 2003).
A stock screen of the ASX 200 using % Price Move (1 month: +5%) fell sharply to 26 stocks (compared to 131 on April 11, 2003; and 8 on March 14, 2003).
- Gold (3)
- Construction & Engineering (3)
Daily Trading Diary
Stocks analyzed during the week were:
Stocks analyzed during the week were:
- Westpac -WBC
- ANZ Bank - ANZ
- St George - SGB
- Bank of Queensland - BOQ
- Australian Stock Exchange - ASX
- Perpetual - PPT
- Sydney Futures Exchange - SFE
- Macquarie Bank - MBL
- Insurance Australia - IAG
- QBE Insurance - QBE
- Oxiana - OXR
- Resolute Mining - RSG
- Lihir - LHG
- Croesus - CRS
Understanding
the Trading Diary has been expanded to offer further
assistance to readers, including directions on how to search the
archives.
Colin Twiggs
We see the world, not as it is, but as we
are -- or as we are conditioned to see
it.
.......The more we are aware of our basic paradigms, maps, or assumptions,
and the extent we have been influenced by our experience,
the more we can take responsibility for those paradigms,
examine them, test them against reality,
listen to others and be open to their perceptions,
thereby getting a larger picture and a far more objective view.
~ Stephen Covey: The Seven Habits of Highly Effective People.
Incredible Charts Premium version with adjusted data and hourly updates
and the Daily Trading Diary.
Back Issues
You can now view back issues at the Daily Trading Diary Archives.
You can now view back issues at the Daily Trading Diary Archives.
Back Issues
Access the Trading Diary Archives.