|
Incredible Charts version
4.0.2.500 The new update is now available. Check Help>>About to ensure that your software has been automatically updated. See What's New for details. |
Trading Diary
September 19, 2003
These extracts from my daily trading diary
are for educational purposes
and should not be interpreted as investment
advice. Full terms and conditions can be found at Terms
of Use .
USA
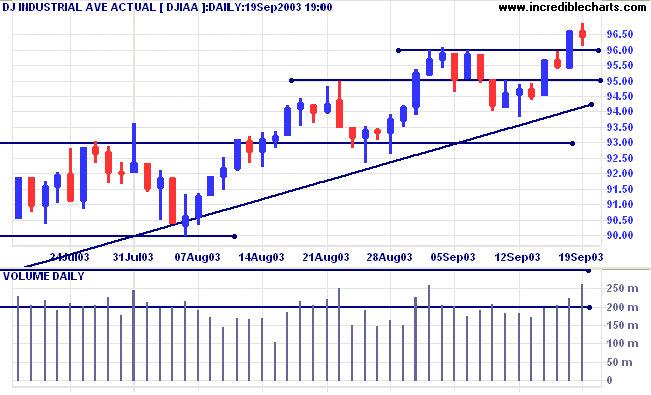
The Dow Industrial Average indicating selling
pressure with a narrow range and slightly lower close at 9645.
Higher volume is similar to the last two short-term peaks.
The intermediate trend is up. Continued low volume signals weakness.
The primary trend is up.
The intermediate trend is up. Continued low volume signals weakness.
The primary trend is up.
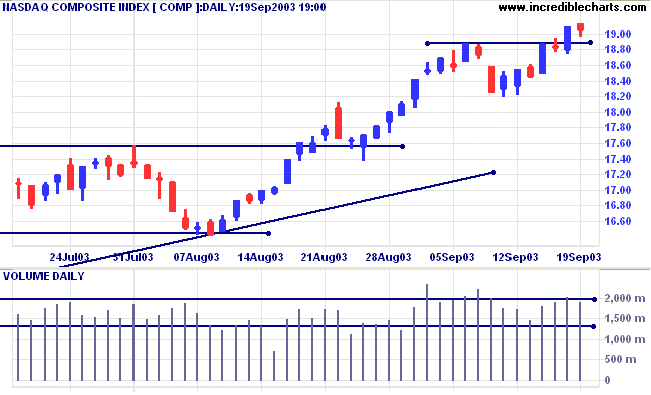
The Nasdaq Composite also encountered selling
pressure, closing 4 points lower at 1906 on slightly lower
volume.
The intermediate trend is up.
The primary trend is up.
The intermediate trend is up.
The primary trend is up.
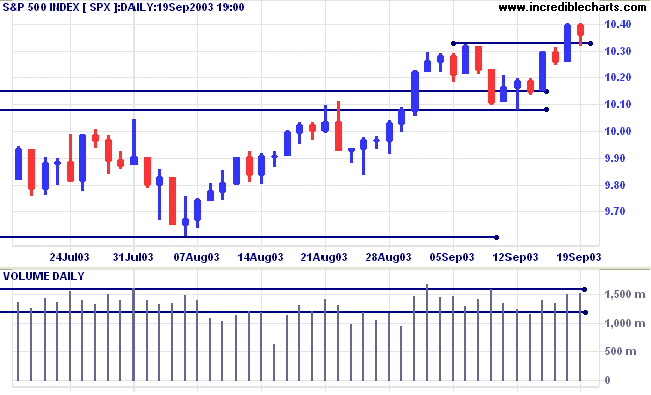
The S&P 500 lost 4 points to close at 1036
on higher volume.
The intermediate trend is up.
The primary trend is up.
The intermediate trend is up.
The primary trend is up.
The Chartcraft NYSE Bullish % Indicator is at a
ten-year high of 80.75% (September 19).
Market Strategy
Short-term: Long if the S&P500 is above 1040.
Intermediate: Long if S&P 500 is above 1040.
Long-term: Long is the index is above 1008.
Short-term: Long if the S&P500 is above 1040.
Intermediate: Long if S&P 500 is above 1040.
Long-term: Long is the index is above 1008.
What the Fed really means
The Fed may not be as gloomy about unemployment and inflation as its announcement appears. They may really be trying to show their commitment to hold interest rates low for as long as necessary. (more)
The Fed may not be as gloomy about unemployment and inflation as its announcement appears. They may really be trying to show their commitment to hold interest rates low for as long as necessary. (more)
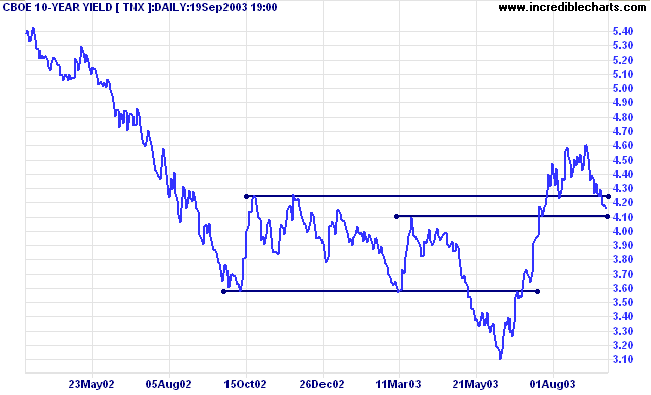
Treasury yields
The yield on 10-year treasury notes is lower at 4.16%, testing support at 4.10% to 4.00%.
The intermediate and primary trends are both up.
The yield on 10-year treasury notes is lower at 4.16%, testing support at 4.10% to 4.00%.
The intermediate and primary trends are both up.
Gold
New York (13.30): Spot gold closed the week up 6 dollars at $381.10.
The primary trend is up.
Price has broken above a symmetrical triangle formed since the start of the year. If gold rises above resistance at 382, the target is the 10-year high of 420.
New York (13.30): Spot gold closed the week up 6 dollars at $381.10.
The primary trend is up.
Price has broken above a symmetrical triangle formed since the start of the year. If gold rises above resistance at 382, the target is the 10-year high of 420.
ASX Australia
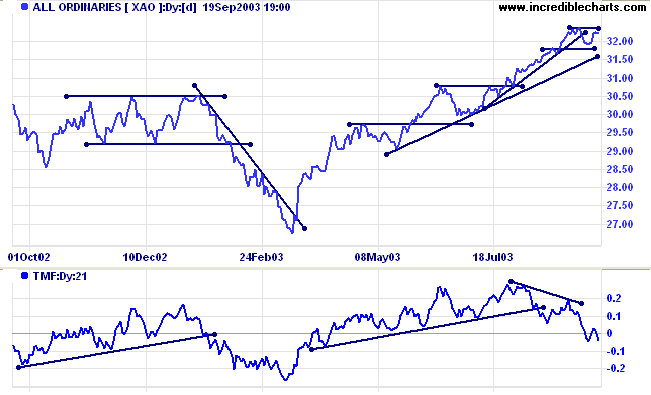
The All Ordinaries closed 2 points lower at 3223, with selling
pressure at the previous high.
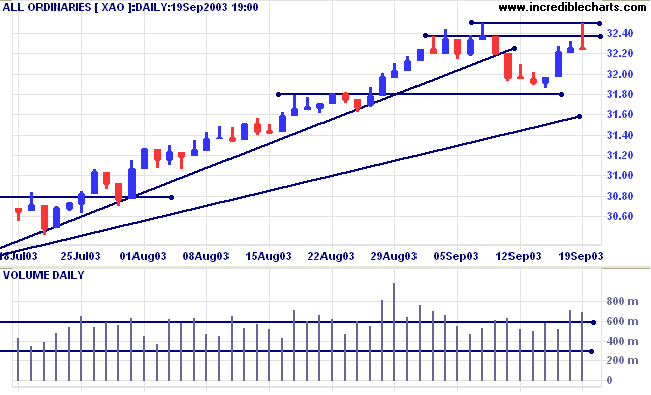
The intermediate trend is up but the index has broken its upward
trendline.
The primary trend is up.
MACD (26,12,9) is below its signal line; Slow Stochastic (20,3,3) has crossed to above its signal line;
Twiggs Money Flow displays a bearish divergence.
The primary trend is up.
MACD (26,12,9) is below its signal line; Slow Stochastic (20,3,3) has crossed to above its signal line;
Twiggs Money Flow displays a bearish divergence.
Market Strategy
Short-term: Long above 3250.
Intermediate: Long if the index is above 3250.
Long-term: Long if the index is above 3180.
Short-term: Long above 3250.
Intermediate: Long if the index is above 3250.
Long-term: Long if the index is above 3180.
Sector Analysis
Changes are highlighted in bold.
Changes are highlighted in bold.
- Energy [XEJ] - stage 2 (RS is rising).
- Materials [XMJ] - stage 2 (RS is rising)
- Industrials [XNJ] - stage 1 (RS is level)
- Consumer Discretionary [XDJ] - stage 2 (RS is rising)
- Consumer Staples [XSJ] - stage 1 (RS is falling)
- Health Care [XHJ] - stage 2 (RS is rising)
- Property Trusts [XPJ] - stage 3 (RS is falling)
- Financial excl. Property Trusts [XXJ] - stage 2 (RS is falling)
- Information Technology [XIJ] - stage 2 (RS is rising)
- Telecom Services [XTJ] - stage 2 (RS is rising).
- Utilities [XUJ] - stage 3 (RS is falling)
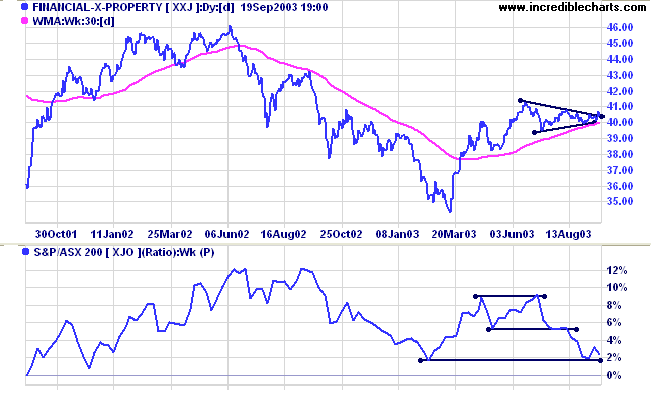
Financial index XXJ has completed a symmetrical triangle with an
upward breakout, a bullish sign. Relative Strength, however, is
falling, and a close below the February low will be a strong bear
signal.
Sectors: Relative Strength
A stock screen of the ASX 200 using % Price Move (1 month: +5%) has increased to 67 stocks (compared to 131 on April 11, 2003; and 8 on March 14, 2003).
A stock screen of the ASX 200 using % Price Move (1 month: +5%) has increased to 67 stocks (compared to 131 on April 11, 2003; and 8 on March 14, 2003).
- Diversified Metals & Mining (6)
- Gold (6)
- Diversified Commercial (4)
- Construction & Engineering (4)
- Diversified Financial (4)
- Oil & Gas Exploration & Production (3)
Daily Trading Diary
Stocks analyzed during the week were:
Stocks analyzed during the week were:
- Harvey Norman - HVN
- Australian Worldwide Exploration - AWE
- Crane Group - CRG
- Coca Amatil - CCL
- Telecom NZ - TEL
- Aquarius Platinum - AQP
Understanding
the Trading Diary has been expanded to offer further
assistance to readers, including
directions on how to search the archives.
Colin Twiggs
Advice is what we ask for when we already know
the answer but wish we didn't.
~ Erica Jong.
~ Erica Jong.
Become a Premium Member
for only
$270
for only
$270
Includes
Incredible Charts Premium version with hourly
updates
and the Daily Trading Diary (click here for a free sample).
and the Daily Trading Diary (click here for a free sample).
Back Issues
You can now view back issues at the Daily Trading Diary Archives.
You can now view back issues at the Daily Trading Diary Archives.
Back Issues
Access the Trading Diary Archives.