|
Incredible Charts version 4.0.2.400 (a minor revision) is now available
Check Help >> About to ensure that your version has automatically updated. (1) The new version remembers the last active watchlist that you used, on opening; and (2) It fixes a watchlist scrolling problem reported by some users. See What's New for details. |
Trading Diary
August 28, 2003
The intermediate trend is up. MACD has completed a bearish divergence.
The primary trend is up.
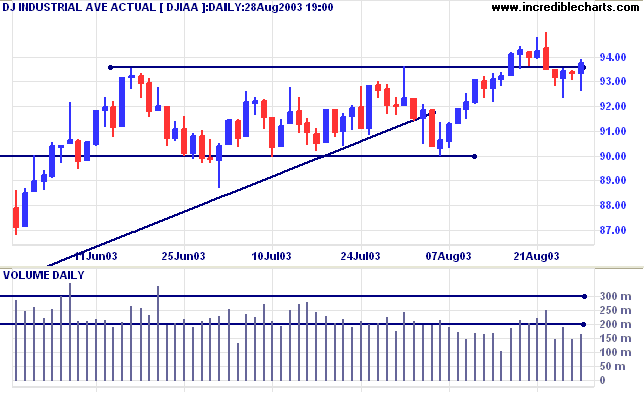
The intermediate trend is up.
The primary trend is up.
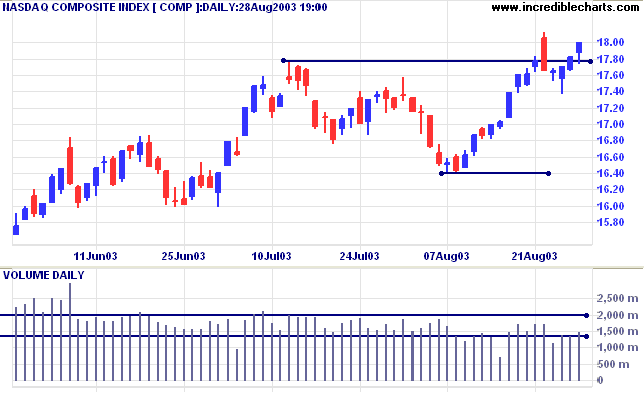
The intermediate trend is down.
The primary trend is up.
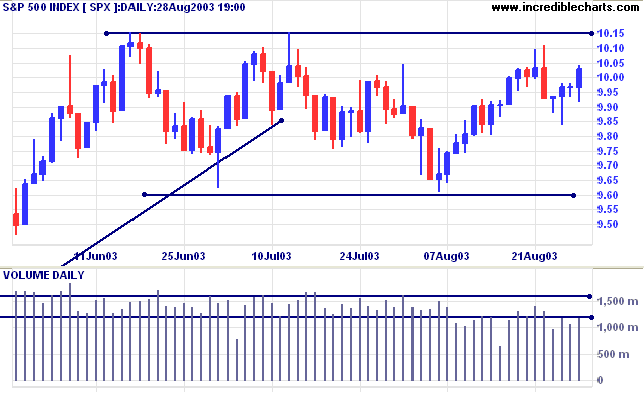
Short-term: Long if the S&P500 is above 1000. Short if below 991.
Intermediate: Long if S&P 500 is above 1015. Short if below 960.
Long-term: Long is the index is above 960.
New unemployment claims increased to 394,000 last week. (more)
The yield on 10-year treasury notes is lower at 4.43%.
The intermediate and primary trends are both up.
New York (17.56): Spot gold held steady at $369.40.
The primary trend is up.
A bullish ascending triangle is forming, with resistance between 370 and 380.
The target for a breakout is the 10-year high of $420: 370 + 370 - 320.
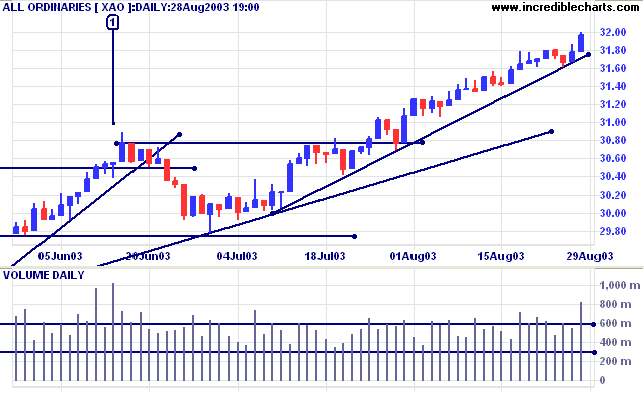
MACD (26,12,9) has whipsawed back above its signal line; Slow Stochastic (20,3,3) is below; Twiggs Money Flow (21) signals accumulation.
Short-term: Long if the All Ords is above 3187. Short if the intermediate trend reverses.
Intermediate: Long if the index is above 3187.
Long-term: Long if the index is above 2978 .
The Aussie has fallen below US$ 0.65, a bear sign.
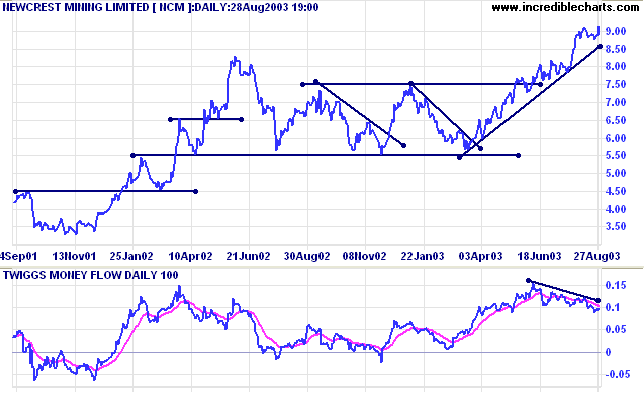
We will continue with gold stocks:
Price broke out of a rectangular trading range in June. The target is 9.50 (7.50 + 7.50 - 5.50).
Twiggs Money Flow (100) signals accumulation but has started to decline since the breakout, forming a bearish divergence.
Relative Strength is rising, while MACD has completed a bullish trough above zero.
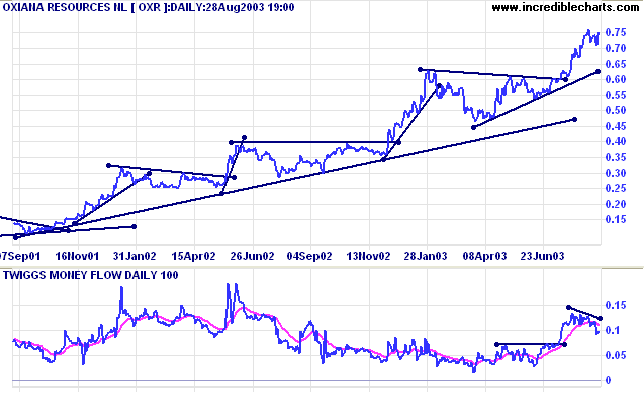
Price broke out of a symmetrical triangle in July. The target is 0.765 (0.60 + 0.63 - 0.465).
Twiggs Money Flow (100) signals strong accumulation but has lately started to decline, displaying a bearish divergence.
Relative Strength is rising and MACD is bullish.
Price formed a stage 1 base with a large ascending triangle. The target is 4.24 (2.80 + 2.80 - 1.36).
Twiggs Money Flow (100) has climbed strongly to signal accumulation; MACD has completed a bullish trough above zero; and Relative Strength is rising.
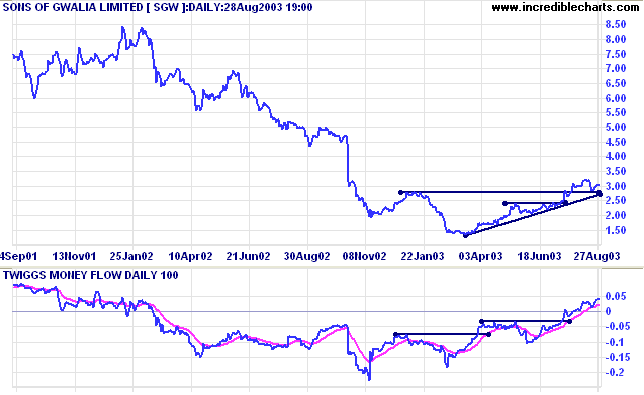
Low volume on the false break below 2.80 at [2] signaled a lack of selling pressure and increased the likelihood that the support level would hold.
A surge of volume on the inside day at [3] signals an inability to move prices despite heavy volume and we may see another re-test of support.
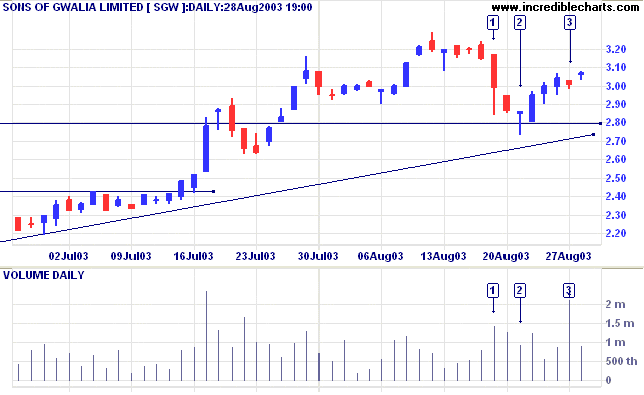
A close below 2.80 would be bearish.
It is not necessary for an investor to know
more than one thing,
but he certainly has to know that.
~ Warren Buffett.
they are now permanently available and no longer need to be "switched on".
Some members were previously unable to find them.
See Format Charts and Indicator Smoothing.
You can now view back issues at the Daily Trading Diary Archives.
Back Issues

Author: Colin Twiggs is a former investment banker with almost 40 years of experience in financial markets. He co-founded Incredible Charts and writes the popular Trading Diary and Patient Investor newsletters.
Using a top-down approach, Colin identifies key macro trends in the global economy before evaluating selected opportunities using a combination of fundamental and technical analysis.
Focusing on interest rates and financial market liquidity as primary drivers of the economic cycle, he warned of the 2008/2009 and 2020 bear markets well ahead of actual events.
He founded PVT Capital (AFSL No. 546090) in May 2023, which offers investment strategy and advice to wholesale clients.