Trading Diary
July 11, 2003
These extracts from my daily trading diary are
intended to illustrate the techniques used in short-term trading
and should not be interpreted as investment advice. Full terms
and conditions can be found at Terms
of Use .
USA
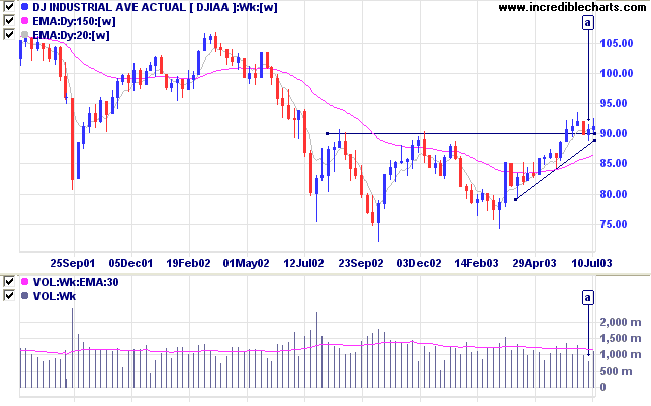
The Dow gained 0.9% on Friday to close at 9119
on higher volume.
The intermediate trend is up. The index has formed a bullish symmetrical triangle above support at 9000. Volume is lower at [a] but the significance is reduced as this was a short week.
The primary trend is up.
The intermediate trend is up. The index has formed a bullish symmetrical triangle above support at 9000. Volume is lower at [a] but the significance is reduced as this was a short week.
The primary trend is up.
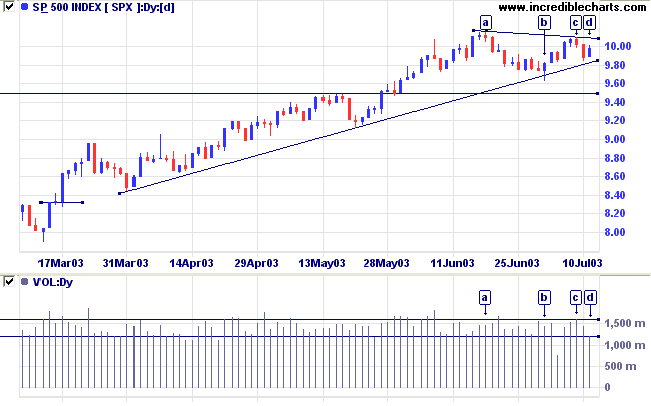
The S&P 500 formed a hook reversal, up 10
points at 998.
The intermediate trend is up. The index has formed a symmetrical triangle from [a] to [d], a bullish sign when it occurs above a major support level such as 950.
The primary trend is up.
The intermediate trend is up. The index has formed a symmetrical triangle from [a] to [d], a bullish sign when it occurs above a major support level such as 950.
The primary trend is up.
The Nasdaq Composite rallied 1.0% to close at
1733 on lower volume.
The intermediate trend is up.
The primary trend is up.
The Chartcraft NYSE Bullish % Indicator is up 1.2% on last week at 76.19% (July 11).
The intermediate trend is up.
The primary trend is up.
The Chartcraft NYSE Bullish % Indicator is up 1.2% on last week at 76.19% (July 11).
Market Strategy
Short-term: Long if the S&P500 is above 1010. Short if below 983.
Intermediate: Long if S&P 500 is above 1010.
Long-term: Long.
Short-term: Long if the S&P500 is above 1010. Short if below 983.
Intermediate: Long if S&P 500 is above 1010.
Long-term: Long.
Trade gap
The US trade gap widens to the third highest on record, as exports disappoint despite the weak dollar. (more)
The US trade gap widens to the third highest on record, as exports disappoint despite the weak dollar. (more)
Gold
New York (13.30): Spot gold closed the week at $344.50.
The primary trend is still upwards.
New York (13.30): Spot gold closed the week at $344.50.
The primary trend is still upwards.
ASX Australia
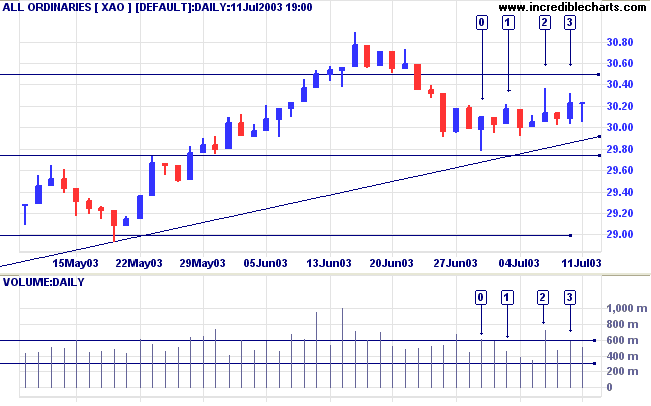
The All Ordinaries closed Friday unchanged at
3023 on lower volume, after earlier testing support levels.
The market has shown a great deal of indecision over the past 2 weeks. Strong buying support is evident at [0] but volume dried up on the subsequent rally [1]. The next rally encountered heavy selling pressure at [2] and again at [3].
The intermediate trend is marginally up. A rally in the US should help the market to break out of the present consolidation.
The primary trend is up (marginally).
Slow Stochastic (20,3,3) is above its signal line; MACD (26,12,9) is below; Twiggs Money Flow signals accumulation.
Market Strategy
Short-term: Long if the All Ords is above 3037. Short if the index falls below 2978.
Intermediate: Long if the index is above 3037.
Long-term: Long.
Short-term: Long if the All Ords is above 3037. Short if the index falls below 2978.
Intermediate: Long if the index is above 3037.
Long-term: Long.
Sector Analysis
Changes are highlighted in bold.
Changes are highlighted in bold.
- Energy [XEJ] - stage 2 (RS is rising) This is a V-bottom and may fall back to stage 1.
- Materials [XMJ] - stage 3 (RS is falling)
- Industrials [XNJ] - stage 1 (RS is falling)
- Consumer Discretionary [XDJ] - stage 1 (RS is level)
- Consumer Staples [XSJ] - stage 1 (RS is level) This was a V-bottom and appears to be re-entering stage 1.
- Health Care [XHJ] - stage 1 (RS is falling)
- Property Trusts [XPJ] - stage 2 (RS is level)
- Financial excl. Property Trusts [XXJ] - stage 2 (RS is level)
- Information Technology [XIJ] - stage 4 (RS is falling)
- Telecom Services [XTJ] - stage 1 (RS is level)
- Utilities [XUJ] - stage 2 (RS is falling)
Sectors: Relative Strength
A stock screen of the ASX 200 using % Price Move (1 month: +5%) is down at 49 stocks (compared to 131 on April 11, 2003; and 8 on March 14, 2003).
A stock screen of the ASX 200 using % Price Move (1 month: +5%) is down at 49 stocks (compared to 131 on April 11, 2003; and 8 on March 14, 2003).
- Oil & Gas Exploration & Production (6)
- Diversified Metals & Mining (3)
Daily Trading Diary
Stocks analyzed during the week were:
Stocks analyzed during the week were:
- Kingsgate - KCN
- Bank of Queensland - BOQ
- Westpac - WBC
- Woodside Petroleum - WPL
- Santos - STO
- ROC Oil - ROC
Understanding
the Trading Diary has been expanded to offer further
assistance to readers.
Colin Twiggs
There is an old saying on Wall Street
that the man who begins to speculate in stocks with the
intention of making a fortune, usually goes broke,
whereas the man who trades with a view of getting good interest
on his money, sometimes gets rich.
- S.A. Nelson: The ABC of Stock Speculation (1902).
Hourly Updates: Refresh Security From
Server
If you have a chart open for a long time during trading hours
click on Securities>>Refresh Security From Server to receive the latest update.
If you have a chart open for a long time during trading hours
click on Securities>>Refresh Security From Server to receive the latest update.
Back Issues
Click here to access the Trading Diary Archives.
Click here to access the Trading Diary Archives.
Back Issues
Access the Trading Diary Archives.