Trading Diary
July 7, 2003
These extracts from my daily trading diary are
intended to illustrate the techniques used in short-term trading
and should not be interpreted as investment advice. Full terms
and conditions can be found at Terms
of Use .
USA
The Dow surged strongly, rising 1.6% to close at 9216 on average volume.
The intermediate trend has turned up.
The primary trend is up.
The Dow surged strongly, rising 1.6% to close at 9216 on average volume.
The intermediate trend has turned up.
The primary trend is up.
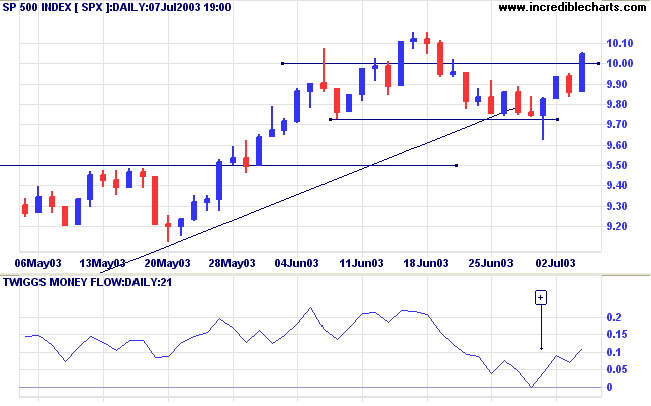
The S&P 500 rallied 19 points to 1004.
The intermediate trend is up.
The primary trend is up.
The intermediate trend is up.
The primary trend is up.
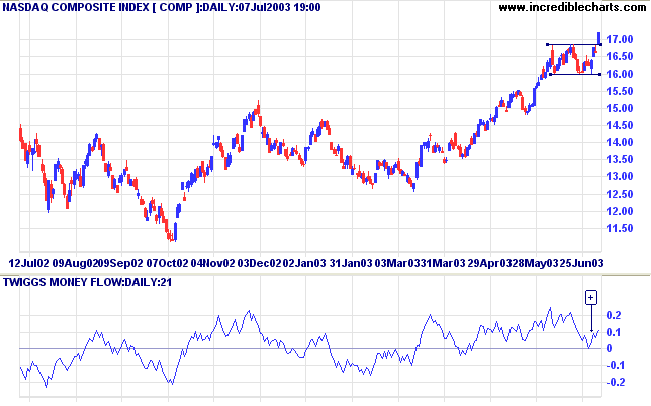
The Nasdaq Composite completed a bullish double bottom, rising
3.4% to close at 1720.
The intermediate trend is up.
The primary trend is up.
The intermediate trend is up.
The primary trend is up.
The Chartcraft NYSE Bullish % Indicator rose to
74.99% on July 3; 0.23% from its peak.
Market Strategy
Short-term: Increase long positions if the S&P 500 is above
995.
Intermediate: Increase long positions if the S&P is above 995.
Long-term: Increase long positions.
Intermediate: Increase long positions if the S&P is above 995.
Long-term: Increase long positions.
Microsoft
The software giant may be considering a $US 10 billion special dividend payout to shareholders. (more)
The software giant may be considering a $US 10 billion special dividend payout to shareholders. (more)
Gold
New York (17.26): Spot gold has fallen to $US 348.20.
On the five-year chart gold is above the long-term upward trendline.
New York (17.26): Spot gold has fallen to $US 348.20.
On the five-year chart gold is above the long-term upward trendline.
ASX Australia
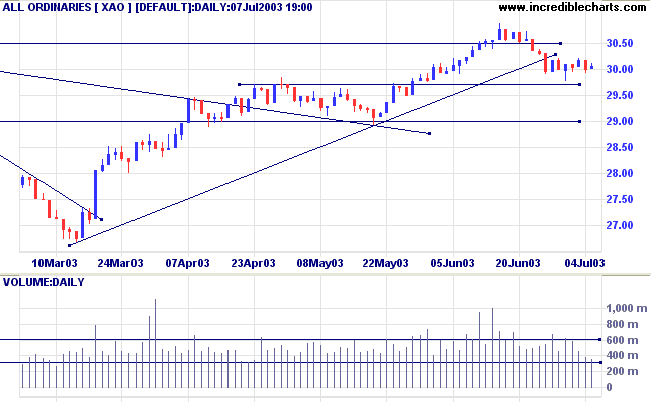
The All Ordinaries formed an inside day, closing up 4 points at
3005 on low volume.
Strong performance in the US should boost the local market.
The intermediate trend is still down.
The primary trend is up.
MACD (26,12,9) and Slow Stochastic (20,3,3) are below their signal lines; Twiggs Money Flow (21) signals accumulation.
Strong performance in the US should boost the local market.
The intermediate trend is still down.
The primary trend is up.
MACD (26,12,9) and Slow Stochastic (20,3,3) are below their signal lines; Twiggs Money Flow (21) signals accumulation.
Market Strategy
Short-term: Long if the All Ords is above 3022.
Intermediate: The primary trend is up; Long if the All Ords is above 3022.
Long-term: Long.
Intermediate: The primary trend is up; Long if the All Ords is above 3022.
Long-term: Long.
Kingsgate [KCN]
KCN broke below the long-term upward trendline in April 2003.
The lower high and break below the previous trough, at [a], confirmed that the primary trend has turned downwards.
Twiggs Money Flow (100-day and 21-day) still signal accumulation but MACD is bearish with a peak below zero at [c].
KCN broke below the long-term upward trendline in April 2003.
The lower high and break below the previous trough, at [a], confirmed that the primary trend has turned downwards.
Twiggs Money Flow (100-day and 21-day) still signal accumulation but MACD is bearish with a peak below zero at [c].
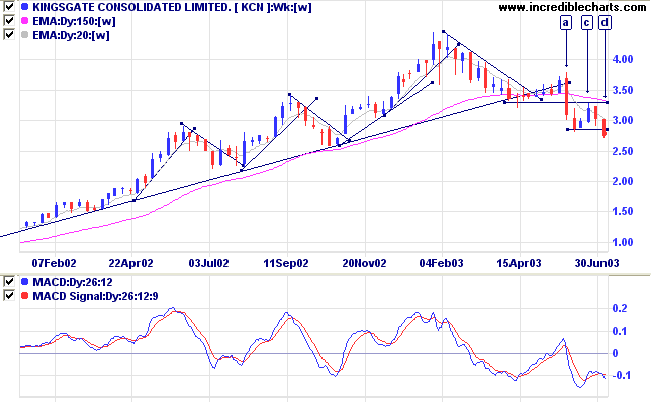
Relative Strength (price ratio: xao) made a new 3-month low at
[a] and again at [d].
The correction back up to [c] failed to penetrate resistance at 3.29 and price then broke through support from the low of [b].
The correction back up to [c] failed to penetrate resistance at 3.29 and price then broke through support from the low of [b].
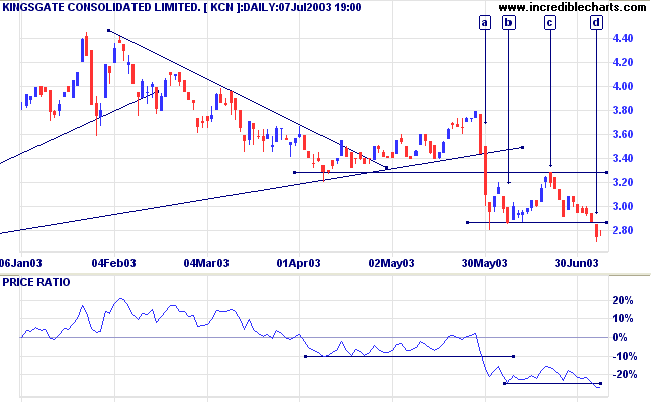
The downward breakout at [b] is a strong bear signal. Further
short entry opportunities may present themselves if price rallies
back to the resistance line with volume and volatility drying
up.
A rise above 3.29 would be bullish.
A rise above 3.29 would be bullish.
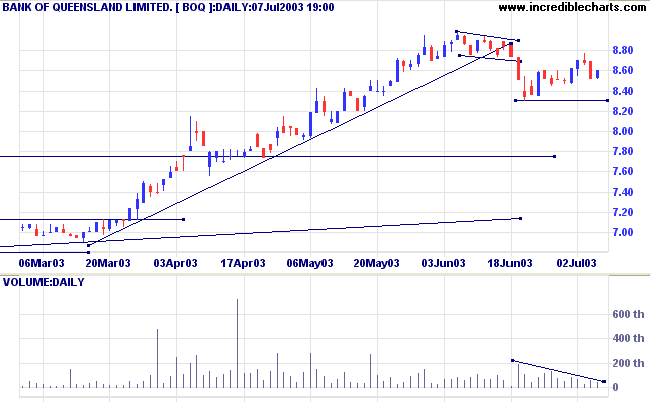
Bank of Queensland [BOQ]
The intermediate trend has turned back up after a break below the upward trendline.
Daily volume has dried up on the latest rally and a break below 8.30 may signal a re-test of the primary supporting trendline.
Twiggs Money Flow (100-day and 21-day) signal distribution but MACD and Relative Strength (price ratio: xao) are neutral.
Understanding
the Trading Diary has been expanded to offer further
assistance to readers.
Colin Twiggs
If everyone is thinking alike, then somebody isn't
thinking.
~ General George S. Patton.
~ General George S. Patton.
Stock Screens:
Volume Spikes
Breakouts and reversal patterns are usually confirmed by an up-surge of volume.
The volume spike filter compares daily volume to the 50-day exponential moving average of volume
and highlights where volume is at least 1.5 or 2.0 times the moving average.
I find this a useful screen when combined with Volatility Ratio (Schwager)
using a 3-day time period.
Back Issues
Access the Trading Diary Archives.