Become a Premium member for
only $180 (AUD).
Subscribe by 31 May 2003.
The Daily Trading Diary will only be available to Premium members.
We have extended the cut-off until mid-May - to fit in with the introduction of US charts.
Subscribe by 31 May 2003.
The Daily Trading Diary will only be available to Premium members.
We have extended the cut-off until mid-May - to fit in with the introduction of US charts.
Trading Diary
May 19, 2003
These extracts from my daily trading diary are
intended to illustrate the techniques used in short-term trading
and should not be interpreted as investment advice. Full terms
and conditions can be found at Terms
of Use .
USA
The Dow fell more than 2% to close at 8493 on
lower volume; breaking below the
pennant pattern.
The intermediate upward trendline has been broken, signaling weakness.
The primary trend is down; a rise above 9076 will signal a reversal.
The intermediate upward trendline has been broken, signaling weakness.
The primary trend is down; a rise above 9076 will signal a reversal.
The S&P 500 pulled back sharply, closing 24
points lower at 920.
The intermediate upward trendline is broken, signaling weakness.
The primary trend is down; a rise above 954 will signal an up-trend.
The intermediate upward trendline is broken, signaling weakness.
The primary trend is down; a rise above 954 will signal an up-trend.
The Nasdaq Composite also broke its intermediate
trendline, closing 3% down at 1492.
The intermediate trend is up, but weakening.
The index is in a primary up-trend.
The intermediate trend is up, but weakening.
The index is in a primary up-trend.
The Chartcraft NYSE
Bullish % Indicator climbed to 61.29% on May 16, following a
Bull
Correction buy signal on April 3.
Market Strategy
Short-term: Short if the S&P intermediate
trend reverses down (or falls below 898).
Intermediate: Long if the Dow/S&P primary
trend turns upwards; short if the intermediate trend (S&P)
reverses down.
Long-term: There are already two bull signals: the March 17 follow through day and the April 3 NYSE Bullish % signal. Wait for confirmation from a Dow/S&P primary trend reversal.
Long-term: There are already two bull signals: the March 17 follow through day and the April 3 NYSE Bullish % signal. Wait for confirmation from a Dow/S&P primary trend reversal.
Dollar slide affects market
Treasury Secretary John Snow's comments imply that the US government is comfortable with a weaker dollar. (more)
Treasury Secretary John Snow's comments imply that the US government is comfortable with a weaker dollar. (more)
Gold
New York (18.35): Spot gold has surged to $US 365.80.
On the five-year chart gold has respected the long-term upward trendline.
New York (18.35): Spot gold has surged to $US 365.80.
On the five-year chart gold has respected the long-term upward trendline.
ASX Australia
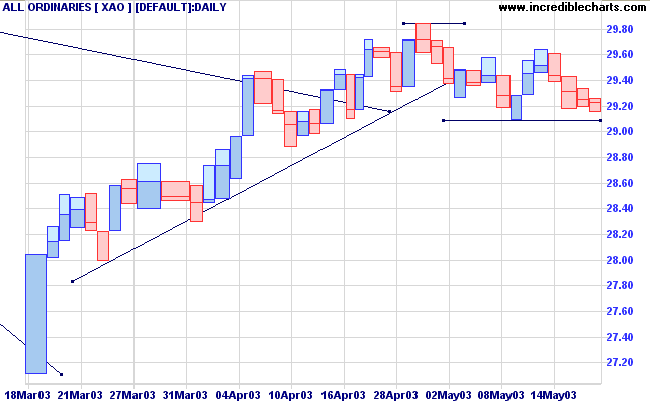
The All Ordinaries closed 1 point lower at 2923 on average
volume. Long shadows for the last three trading days signal
buying support, but this may evaporate after the sharp correction
in the US market.
The intermediate up-trend is weak and a close below 2909 will signal a reversal.
The primary trend is down. A rise above 3062 will signal an up-trend.
MACD (26,12,9) is below its signal line; Slow Stochastic (20,3,3) is below; Twiggs Money Flow (21) is weakening.
The intermediate up-trend is weak and a close below 2909 will signal a reversal.
The primary trend is down. A rise above 3062 will signal an up-trend.
MACD (26,12,9) is below its signal line; Slow Stochastic (20,3,3) is below; Twiggs Money Flow (21) is weakening.
Market Strategy
Short-term: Long if the All Ords rises above 2926; short if the
XAO falls below 2909.
Intermediate: Long if the primary trend reverses up (XAO above 3062); short if the intermediate trend reverses down (falls below 2909).
Long-term: There is already a bull signal: the March 18 follow through. Wait for confirmation from a primary trend reversal.
Intermediate: Long if the primary trend reverses up (XAO above 3062); short if the intermediate trend reverses down (falls below 2909).
Long-term: There is already a bull signal: the March 18 follow through. Wait for confirmation from a primary trend reversal.
Symex Holdings [SYM]
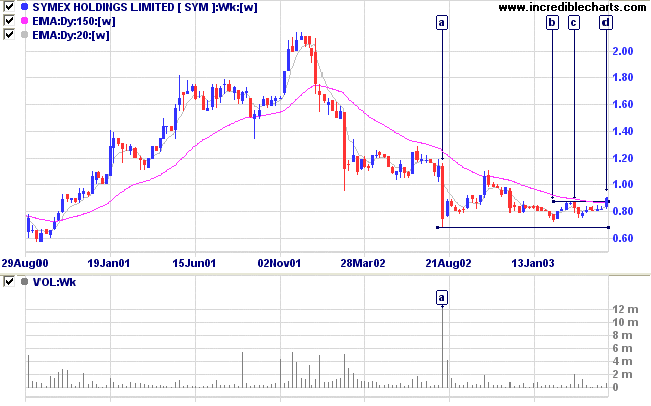
SYM has formed a new 3-month high [d] after a broad base, following a steep stage 4 down-trend.
Note the sharp downward spike at [a] accompanied by huge volume - commonly referred to as a shakeout. This normally establishes a strong support level for the stock, evident on the chart below. SYM re-tested support at [b] after an initial rally had formed a vulnerable V-bottom. And we now have a break above the high of [c], signaling an up-turn.
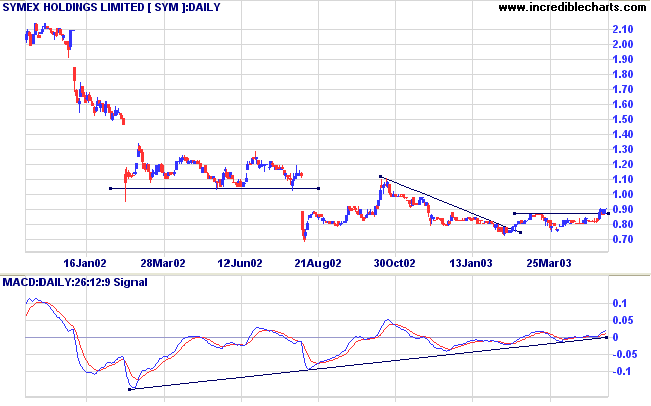
MACD shows a strong bullish divergence and Twiggs Money Flow
(21-day) signals accumulation.
Resistance is evident at 0.87 on the equivolume chart, with
strong selling into the rally at [1]. SYM then tested support,
reflected by the over-square bar at [2], before rallying above
the previous high.
The power bar at [3] shows a healthy breakout and the pull-back at [5] only lasted one day.
The subsequent rally at [6] is on thin volume and closed back at 0.90; we may encounter further consolidation before the rally continues.
The power bar at [3] shows a healthy breakout and the pull-back at [5] only lasted one day.
The subsequent rally at [6] is on thin volume and closed back at 0.90; we may encounter further consolidation before the rally continues.
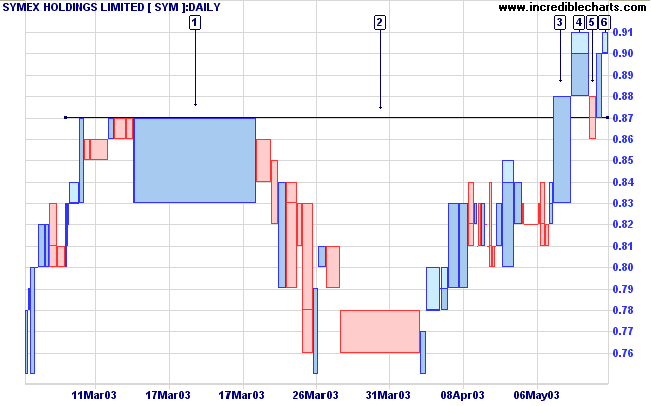
Consolidation above 0.87 will be a bullish sign.
A close below the support level would be bearish.
A close below the support level would be bearish.
New! Understanding
the Trading Diary has been expanded to offer further
assistance to readers.
Colin Twiggs
In times of change, learners inherit the
earth,
while the learned find themselves beautifully equipped
to deal with a world that no longer exists.
- Eric Hoffer.
Back Issues
Click here to access the Trading Diary Archives.
Click here to access the Trading Diary Archives.
Back Issues
Access the Trading Diary Archives.