Become a Premium member for
only $180 (AUD).
Subscribe by 31 May 2003.
The Daily Trading Diary will only be available to Premium members.
We have extended the cut-off until mid-May - to fit in with the introduction of US charts.
Subscribe by 31 May 2003.
The Daily Trading Diary will only be available to Premium members.
We have extended the cut-off until mid-May - to fit in with the introduction of US charts.
Trading Diary
May 13, 2003
These extracts from my daily trading diary are
intended to illustrate the techniques used in short-term trading
and should not be interpreted as investment advice. Full terms
and conditions can be found at Terms
of Use .
USA
The Dow formed an inside day, retreating 0.5% to
close at 8679 on lower volume.
The intermediate trend is up.
The primary trend is down; a rise above 9076 will signal a reversal.
The S&P 500 closed 3 points down at 942.
The intermediate up-trend continues.
The primary trend is down; a rise above 954 will signal a reversal.
The Nasdaq Composite gapped down at the opening but rallied to close almost unchanged at 1539.
The intermediate trend is up.
The break above 1521 provides clear confirmation that the index is in a primary up-trend.
The Chartcraft NYSE Bullish % Indicator rose to 58.94% on May 12, following a Bull Correction buy signal on April 3.
The intermediate trend is up.
The primary trend is down; a rise above 9076 will signal a reversal.
The S&P 500 closed 3 points down at 942.
The intermediate up-trend continues.
The primary trend is down; a rise above 954 will signal a reversal.
The Nasdaq Composite gapped down at the opening but rallied to close almost unchanged at 1539.
The intermediate trend is up.
The break above 1521 provides clear confirmation that the index is in a primary up-trend.
The Chartcraft NYSE Bullish % Indicator rose to 58.94% on May 12, following a Bull Correction buy signal on April 3.
Market Strategy
Short-term: Long if the S&P 500 is above
935; short if the S&P intermediate trend reverses down (or
falls below 897).
Intermediate: Long if the Dow/S&P primary
trend turns upwards; short if the intermediate trend (S&P)
reverses down.
Long-term: There are already two bull signals: the March 17 follow through day and the April 3 NYSE Bullish % signal. Wait for confirmation from a Dow/S&P primary trend reversal.
Long-term: There are already two bull signals: the March 17 follow through day and the April 3 NYSE Bullish % signal. Wait for confirmation from a Dow/S&P primary trend reversal.
Can the tech rally last?
The up-tick in Tech company sales may be due more to postponed replacements than to real growth. (more)
The up-tick in Tech company sales may be due more to postponed replacements than to real growth. (more)
Gold
New York (17.56): Spot gold retreated to $US 349.50.
On the five-year chart gold has respected the long-term upward trendline.
New York (17.56): Spot gold retreated to $US 349.50.
On the five-year chart gold has respected the long-term upward trendline.
ASX Australia
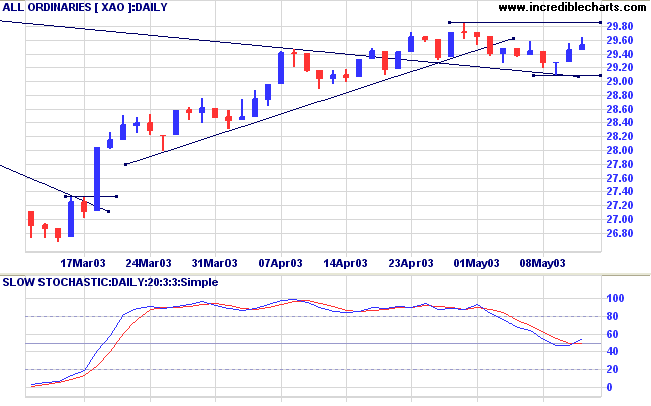
The All Ordinaries gained a further 6 points to close at 2952 on
higher volume. Weak closes on the last two days indicate some
profit-taking.
The intermediate up-trend is weak; a close below 2909 will signal a reversal.
The primary trend is down. A rise above 3062 will signal an up-trend.
MACD (26,12,9) is below its signal line; Slow Stochastic (20,3,3) has crossed to above; Twiggs Money Flow (21) is below its trendline but still signals accumulation.
Market Strategy
Short-term: Long if the XAO is above 2946; short if the XAO falls
below 2909.
Intermediate: Long if the primary trend reverses up (XAO above 3062); short if the XAO falls below 2909.
Long-term: There is already a bull signal: the March 18 follow through. Wait for confirmation from a primary trend reversal.
Intermediate: Long if the primary trend reverses up (XAO above 3062); short if the XAO falls below 2909.
Long-term: There is already a bull signal: the March 18 follow through. Wait for confirmation from a primary trend reversal.
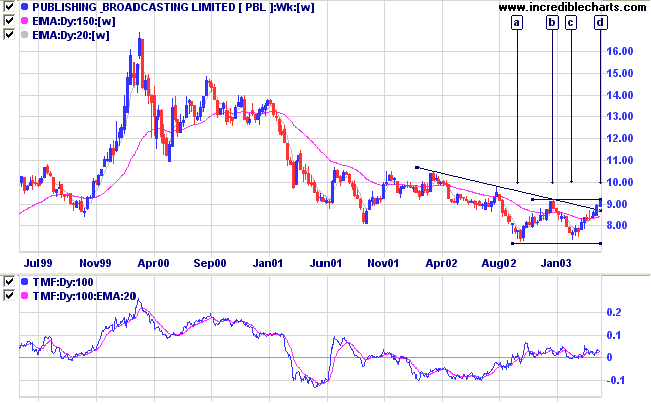
Publishing & Broadcasting Ltd [PBL]
Last covered on July 25, 2002.
PBL threatens to complete a double bottom reversal, [a] to [d], after a lengthy stage 4 down-trend.
Twiggs Money Flow (100-day) signals strong accumulation.
Last covered on July 25, 2002.
PBL threatens to complete a double bottom reversal, [a] to [d], after a lengthy stage 4 down-trend.
Twiggs Money Flow (100-day) signals strong accumulation.
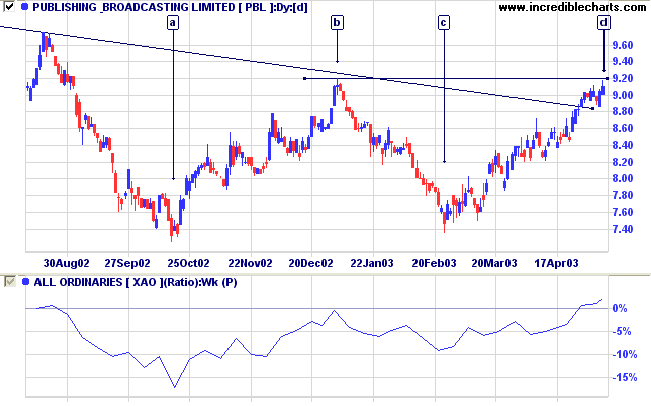
Relative Strength (price ratio: xao) is rising; MACD and Twiggs
Money Flow (21-day) are bullish.
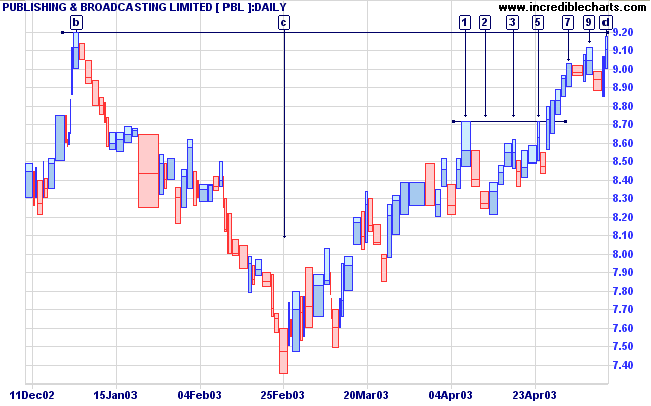
On the equivolume chart we can see that PBL overcame resistance
at 8.60 to 8.70 before rallying to [7].
Subsequent corrections have been very short but on fairly heavy
volume.
The latest rally to [d] is on thin volume and we can expect further consolidation below 9.20 before the double bottom pattern is completed.
The latest rally to [d] is on thin volume and we can expect further consolidation below 9.20 before the double bottom pattern is completed.
The target for the double bottom breakout is 11.00 (9.20 + [9.20
- 7.40]) but there is heavy resistance overhead at 10.50.
New! Understanding
the Trading Diary has been expanded to offer further
assistance to readers.
Colin Twiggs
Making no mistakes is what makes victory
certain:
Avoid what is strong and strike at what is weak
......like water, taking the line of least resistance.
- Sun Tzu: The Art of War.
Back Issues
Click here to access the Trading Diary Archives.
Click here to access the Trading Diary Archives.
Back Issues
Access the Trading Diary Archives.