Full Member version
We should have the free trial available next week.
The free trial period will be extended until 31 May 2003.
We should have the free trial available next week.
The free trial period will be extended until 31 May 2003.
Trading Diary
April 3, 2003
These extracts from my daily trading diary are
intended to illustrate the techniques used in short-term trading
and should not be interpreted as investment advice. Full terms
and conditions can be found at Terms
of Use .
For further guidance see Understanding the Trading Diary.
USA
The Dow eased 0.5% to close at 8240 on lower volume.
Monday 17th's follow through signal remains valid (as long as the index holds above 7763).
The intermediate cycle is down; a rise above 8552 will signal a reversal.
The primary trend is down.
The Nasdaq Composite gapped up at the opening but later weakened to close unchanged at 1396.
The intermediate trend is down; a rise above 1425 will signal a reversal.
The primary trend is up.
The S&P 500 retreated 4 points to close at 876.
The intermediate trend is down, until the index breaks above 895.
The primary trend is down.
The Chartcraft NYSE Bullish % Indicator is at 38% (April 2).
Iraq
Coalition forces approach the outskirts of Baghdad. (more)
Pack behavior
When traders think in packs. (more)
Coalition forces approach the outskirts of Baghdad. (more)
Pack behavior
When traders think in packs. (more)
Gold
New York (17.30): Spot gold is down further at $US 325.10.
New York (17.30): Spot gold is down further at $US 325.10.
ASX Australia
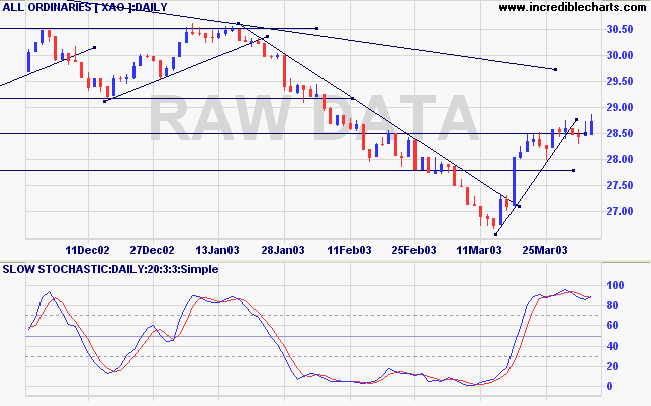
The All Ordinaries rallied to 2847 on higher volume.
The intermediate up-trend has lost momentum; the long upper and lower shadows signal uncertainty.
The primary trend is down.
MACD (26,12,9) is above its signal line; Slow Stochastic (20,3,3) crossed to above its signal line; Twiggs Money Flow (21) signals distribution.
The intermediate up-trend has lost momentum; the long upper and lower shadows signal uncertainty.
The primary trend is down.
MACD (26,12,9) is above its signal line; Slow Stochastic (20,3,3) crossed to above its signal line; Twiggs Money Flow (21) signals distribution.
Strategy
Short-term: Long if XAO rises above 2875; short if the index
falls below 2830.
Intermediate: Long if XAO is above 3062; short if the index is
below 2666.
Long-term: Wait for the March 18 follow through to be confirmed by the intermediate signal above.
Long-term: Wait for the March 18 follow through to be confirmed by the intermediate signal above.
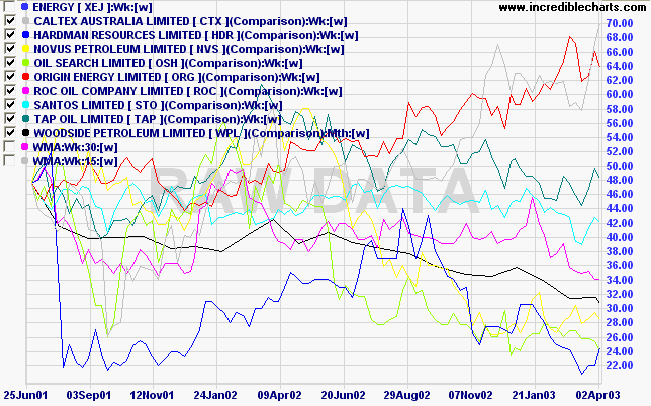
Energy Sector [XEJ]
The Energy index is in a stage 4 down-trend but relative strength is rising and 100-day Twiggs Money Flow signals accumulation.
Two stocks have significantly out-performed the rest of the sector over the past 9 months: Caltex Australia and Origin Energy.
The Energy index is in a stage 4 down-trend but relative strength is rising and 100-day Twiggs Money Flow signals accumulation.
Two stocks have significantly out-performed the rest of the sector over the past 9 months: Caltex Australia and Origin Energy.
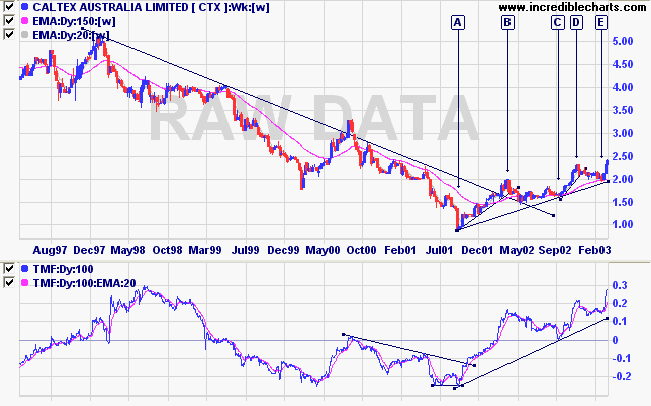
Caltex formed a V-bottom at [A] and I was expecting a re-test of
support at 1.00. The re-test held at the 1.50 level, with Twiggs
Money Flow (100) signaling strong accumulation. The stock has
risen strongly and shows no signs of reversing.
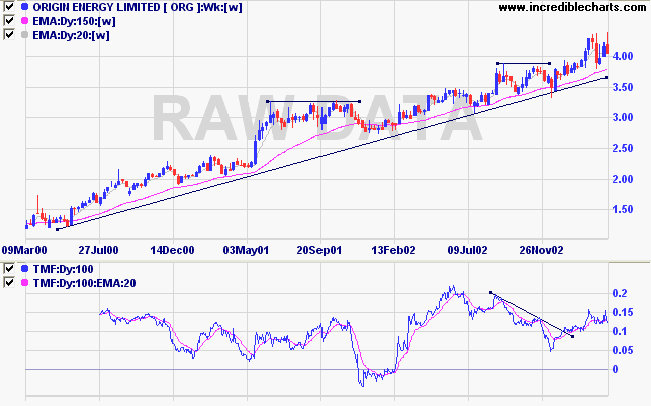
Origin has held above the long-term trendline throughout the
current market weakness. The double top in the last 5 weeks may
signal a re-test of support levels. Twiggs Money Flow (100) is
positive, but not as strong as CTX.
Market strategy
Market strategy has been moved to the Australia heading.
Colin Twiggs
The fool doth think he is wise,
but the wise man knows himself to be a fool.
- William Shakespeare: As You Like It.
Back Issues
Click here to access the
Trading Diary Archives.
Back Issues
Access the Trading Diary Archives.