Delayed Diary
The Bigpond cable connection was down for more than 6 hours this morning.
The Bigpond cable connection was down for more than 6 hours this morning.
Trading Diary
April 2, 2003
These extracts from my daily trading diary are
intended to illustrate the techniques used in short-term trading
and should not be interpreted as investment advice. Full terms
and conditions can be found at Terms
of Use .
USA
The Dow put in a strong rally, rising 2.7% to close at 8285 on
higher volume.
Monday 17th's follow through signal remains valid (so long as the index holds above 7763).
The intermediate cycle is down; a rise above 8552 will signal a reversal.
The primary trend is down.
The Nasdaq Composite gapped strongly upwards, closing 48 points higher at 1396.
The intermediate trend is down; a rise above 1425 will signal a reversal.
The primary trend is up.
The S&P 500 rallied 22 points to close at 880.
The intermediate trend is down, until the index breaks above 895.
The primary trend is down.
The Chartcraft NYSE Bullish % Indicator is at 38% (April 2).
The method of calculation has changed slightly.
Tech Stocks
Hopes for a quick end to the war boosts technology stocks, with Microsoft up more than 5%. (more)
Hopes for a quick end to the war boosts technology stocks, with Microsoft up more than 5%. (more)
Gold
New York (22.06): Spot gold fell sharply to $US 327.60.
New York (22.06): Spot gold fell sharply to $US 327.60.
ASX Australia
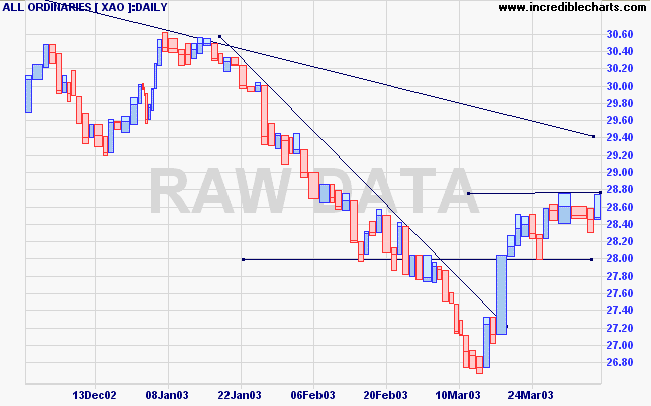
The All Ordinaries made a second test of resistance at 2785, but
gave back most of its gains to close 3 points up at 2847 on lower
volume. Expect a strong showing today following the gains in the
US markets.
The intermediate up-trend has lost momentum; the long upper and lower shadows signal uncertainty.
The primary trend is down.
MACD (26,12,9) is above its signal line; Slow Stochastic (20,3,3) is below; Twiggs Money Flow (21) signals distribution.
The intermediate up-trend has lost momentum; the long upper and lower shadows signal uncertainty.
The primary trend is down.
MACD (26,12,9) is above its signal line; Slow Stochastic (20,3,3) is below; Twiggs Money Flow (21) signals distribution.
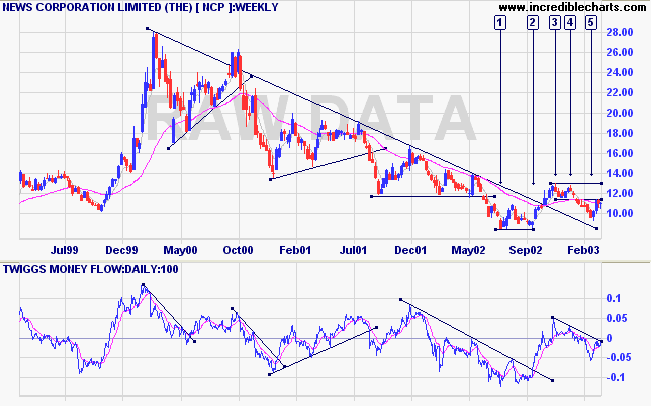
News Corporation [NCP]
Last covered on March 24, 2003.
NCP broke above the long-term downward trendline before forming a double top at [3] and [4]. The latest trough has respected the broken trendline.
100-day Twiggs Money Flow still shows distribution; a rise above zero would be a bull signal.
Relative Strength (price ratio: xao) is level; while MACD and Twiggs Money Flow (21) are neutral.
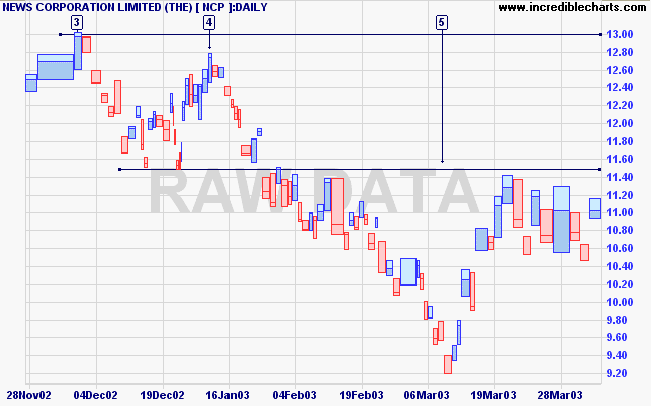
The daily equivolume chart shows NCP has rallied to test
resistance at 11.50. The pull-back is well above the previous low
of [5].
A break above 11.50 on strong volume will be bullish for short-term traders. A break above the high of 13.00 would be a strong long-term signal.
A break below 10.45 would be bearish.
A break above 11.50 on strong volume will be bullish for short-term traders. A break above the high of 13.00 would be a strong long-term signal.
A break below 10.45 would be bearish.
Market strategy
For further guidance see Understanding the Trading Diary.
For further guidance see Understanding the Trading Diary.
Short-term: Long if the All Ords breaks above 2875; short if
the break is below 2800.
Medium-term: Avoid new entries.
Long-term: Wait for confirmation of the
bottom reversal signal.
Colin Twiggs
If a man is offered a fact which goes against his instincts, he
will scrutinize it closely,
and unless the evidence is overwhelming, he will refuse
to believe it.
If, on the other hand, he is offered something which
affords a reason for acting in accordance to his
instincts,
he will accept it even on the slightest evidence.
- Bertrand Russell.
Back Issues
Click here to access the
Trading Diary Archives.
Back Issues
Access the Trading Diary Archives.