Securities menu
We are busy adjusting the menus.
If your Securities menu fails to load, please close the charting application and re-start.
We are busy adjusting the menus.
If your Securities menu fails to load, please close the charting application and re-start.
Trading Diary
March 26, 2003
These extracts from my daily trading diary are
intended to illustrate the techniques used in short-term trading
and should not be interpreted as investment advice. Full terms
and conditions can be found at Terms
of Use .
USA
The Dow formed a further
inside day, signaling uncertainty, and closed down 0.6% at
8229 on lower volume. Monday 17th's
follow through signal remains valid so long as the index
holds above 7763.
The intermediate cycle is down, although the trendline has been broken.
The primary trend is down.
The Nasdaq Composite also formed an inside day, down 4 points at 1387.
The intermediate trend is down, despite the large correction.
The primary trend is up.
The S&P 500 mimicked the Dow, down 0.5% at 869 on an inside day.
The intermediate trend is down, but the trendline has been broken.
The primary trend is down.
The Chartcraft NYSE Bullish % Indicator remains at 36% (March 25).
Iraq
A protracted conflict could lead to a further contraction of the US economy: the much-feared "double dip". (more)
A protracted conflict could lead to a further contraction of the US economy: the much-feared "double dip". (more)
Gold
New York (16.45): Spot gold is up 190 cents at $US 330.10.
New York (16.45): Spot gold is up 190 cents at $US 330.10.
ASX Australia
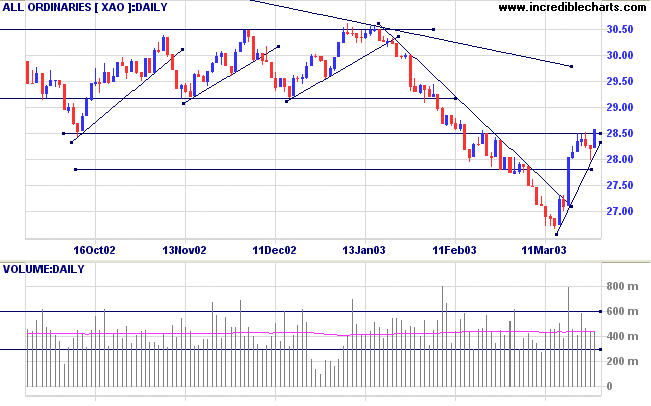
The All Ordinaries broke through resistance, closing up 36 points
at 2858. This confirms that the intermediate trend is now up. The
weak counter-trend signals that the up-trend is strong, but
volume has not increased on the latest rally.
The primary trend is down.
MACD (26,12,9) is above its signal line; Slow Stochastic (20,3,3) has whipsawed back above its signal line; Twiggs Money Flow (21) is rising.
The primary trend is down.
MACD (26,12,9) is above its signal line; Slow Stochastic (20,3,3) has whipsawed back above its signal line; Twiggs Money Flow (21) is rising.
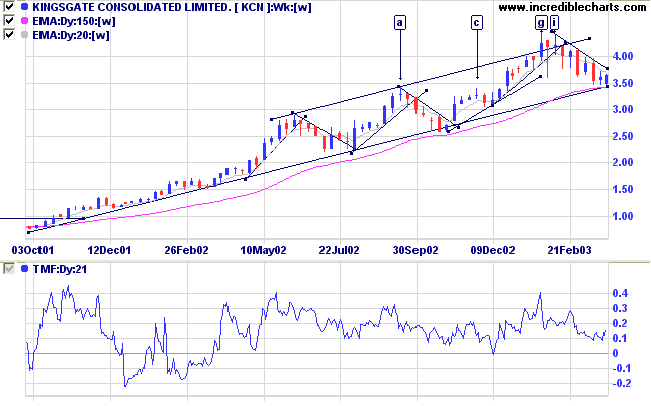
Kingsgate [KCN]
Last covered on January 23, 2003.
The Thai gold miner has pulled back from the double top at [g] and [i] and is now testing the primary supporting trendline.
Relative Strength (price ratio: xao) trends upwards; MACD is negative; Twiggs Money Flow continues to signal strong accumulation.
Spot gold is still above its long-term supporting trendline (5-year chart).
The equivolume chart shows the double top at [g] and [i] was
followed by a correction back to support above 3.40. Three bars
with long shadows, the last at [q], show buyers entering the
market.
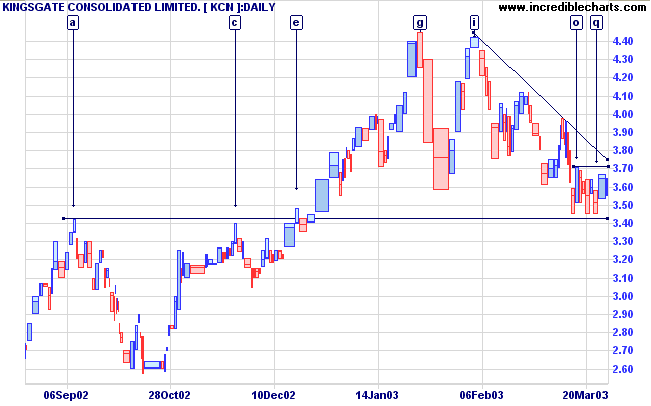
A break above the recent high at [o], accompanied by a break of
the downward trendline, will signal resumption of the primary
up-trend. Look for volume confirmation.
A break below 3.40 would be bearish.
A break below 3.40 would be bearish.
Market strategy
For further guidance see Understanding the Trading Diary.
For further guidance see Understanding the Trading Diary.
Short-term: Long
Medium-term: Avoid new entries.
Long-term: Wait for confirmation of the
bottom reversal signal.
Colin Twiggs
The generals have a saying:
"Rather than make the first move
it is better to wait and see.
Rather than advance an inch
it is better to retreat a yard."
This is called
going forward without advancing,
pushing back without using weapons.
There is no greater misfortune
than underestimating your enemy.
Underestimating your enemy
means thinking that he is evil.
Thus you destroy your three treasures
and become an enemy yourself.
When two great forces oppose each other,
the victory will go
to the one that knows how to yield.
- Lao Tse.
Back Issues
Click here to access the
Trading Diary Archives.
Back Issues
Access the Trading Diary Archives.