Earlier Updates
The new Premium data will include an end-of-day snapshot (equities and indices only)
at 4:30 p.m. AEST.
The new Premium data will include an end-of-day snapshot (equities and indices only)
at 4:30 p.m. AEST.
Trading Diary
March 11, 2003
These extracts from my daily trading diary are
intended to illustrate the techniques used in short-term trading
and should not be interpreted as investment advice. Full terms
and conditions can be found at Terms
of Use .
USA
The Dow closed 0.6% down at 7524 on average volume, just above
the support level.
The intermediate cycle is down; the next support level is at 7500.
The primary trend is down.
The Nasdaq Composite lost 0.5% to close at 1271.
The intermediate trend is down, with the next support level at 1200.
The primary trend is up; a fall below 1108 will signal a reversal.
The S&P 500 fell a further 7 points to close at 800.
The intermediate trend is down.
The primary trend is down; the next support level is at 768.
The Chartcraft NYSE Bullish % Indicator is at 38% (March 10).
Tough market
Stocks continue to sink on concerns over Iraq. Warnings from Maytag and Nokia added to the gloom. (more)
Stocks continue to sink on concerns over Iraq. Warnings from Maytag and Nokia added to the gloom. (more)
Gold
New York (16.40): Spot gold fell 340 cents to $US 350.80.
New York (16.40): Spot gold fell 340 cents to $US 350.80.
ASX Australia
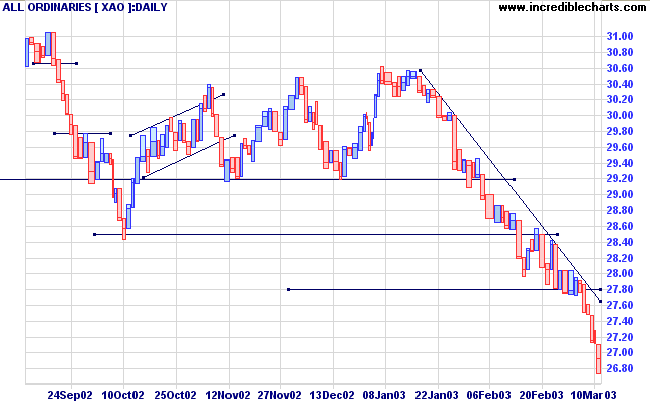
The All Ordinaries lost a further 19 points to close at 2692. The
weaker close and higher volume signals the return of some buyers
to the market in late trading. The next support level is just
below 2400.
MACD (26,12,9) is below its signal line; Slow Stochastic (20,3,3)
crossed to above; Twiggs Money Flow signals distribution.
Metcash Trading [MTT]
Last covered on September 4, 2002.
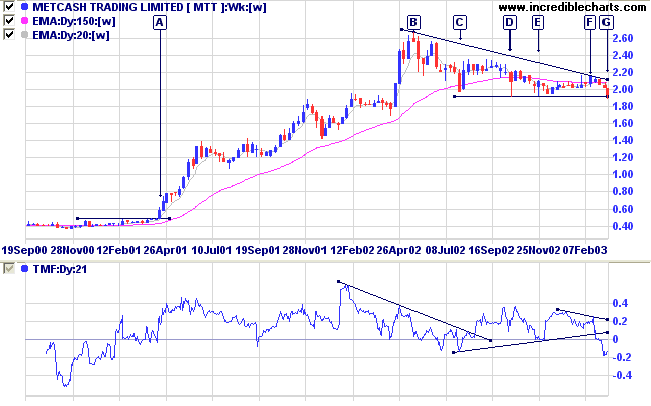
After breaking out from a base at [A] MTT commenced a stage 2 up-trend to [B]. The stock then formed a lower high, followed by a descending triangle with equal lows at [C], [D] and [E]. There is now a break below support at [G].
Relative Strength (price ratio: xao) is level; MACD is negative; and Twiggs Money Flow shows a bearish divergence.
The Consumer Staples sector trends downward.
Last covered on September 4, 2002.
After breaking out from a base at [A] MTT commenced a stage 2 up-trend to [B]. The stock then formed a lower high, followed by a descending triangle with equal lows at [C], [D] and [E]. There is now a break below support at [G].
Relative Strength (price ratio: xao) is level; MACD is negative; and Twiggs Money Flow shows a bearish divergence.
The Consumer Staples sector trends downward.
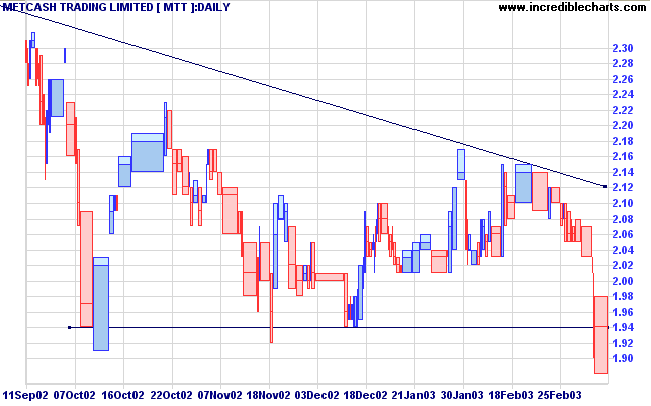
The equivolume chart shows two previous false breaks below
support at 1.94. The long shadow and heavy volume on the latest
bar signal the presence of buying support at this
level.
With the bearish triangle pattern, and the weak state of the market, watch for volume drying up above the support level and another attempt to break below. A break within the next few days would be a fairly strong bear signal. A fall below 1.88 would add weight to the signal.
With the bearish triangle pattern, and the weak state of the market, watch for volume drying up above the support level and another attempt to break below. A break within the next few days would be a fairly strong bear signal. A fall below 1.88 would add weight to the signal.
Market strategy
For further guidance see Understanding the Trading Diary.
For further guidance see Understanding the Trading Diary.
Short-term: Short if the All Ordinaries falls below 2673.
Slow Stochastic and MACD are on opposite sides of their
respective signal lines.
Medium-term: Avoid new entries.
Long-term: Wait for confirmation of the
bottom reversal signal.
Colin Twiggs
In the middle of difficulty lies opportunity.
- Albert Einstein
Back Issues
Click here to access the
Trading Diary Archives.
Back Issues
Access the Trading Diary Archives.