Full Member Version
We are making good progress
and will announce a start date shortly.
One area that is likely to be delayed is dividend data
- we have to find another data supplier due to reliability issues.
Trading Diary
February 24, 2003
These extracts from my daily trading diary are
intended to illustrate the techniques used in short-term trading
and should not be interpreted as investment advice. Full terms
and conditions can be found at Terms
of Use .
USA
The Dow closed 2% down at 7858 on lower volume,
still in the congestion zone.
The next support level is 7500.
The primary trend is down.
The Nasdaq Composite formed an inside day, signaling uncertainty, and closed down 2% at 1322.
The primary trend is up.
The S&P 500 also weakened, closing 16 points down at 832. The current congestion signals uncertainty.
The next support level is at 768.
The primary trend is down.
The Chartcraft NYSE Bullish % Indicator is at 42% (February 21).
Oil at 2-year high
Oil is trading around $US 36 per barrel, because of the threat of supply disruption. (more)
Oil is trading around $US 36 per barrel, because of the threat of supply disruption. (more)
Gold
New York (16.57): Spot gold is up 660 cents at $US 357.10.
New York (16.57): Spot gold is up 660 cents at $US 357.10.
ASX Australia
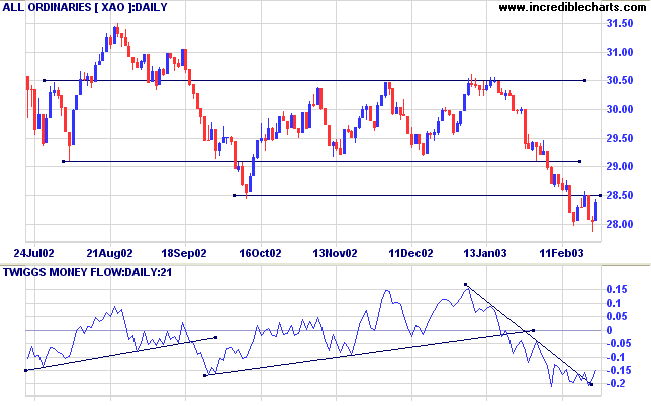
The All Ordinaries closed 33 points up at 2837. Low volume
signals that the rally will have difficulty overcoming the 2850
resistance level. The next support level is at 2779 (from October
1999).
Slow Stochastic (20,3,3) continues to whipsaw around its signal line; MACD (26,12,9) is below. Twiggs Money Flow again crossed above its trendline, forming a small bullish divergence.
Slow Stochastic (20,3,3) continues to whipsaw around its signal line; MACD (26,12,9) is below. Twiggs Money Flow again crossed above its trendline, forming a small bullish divergence.
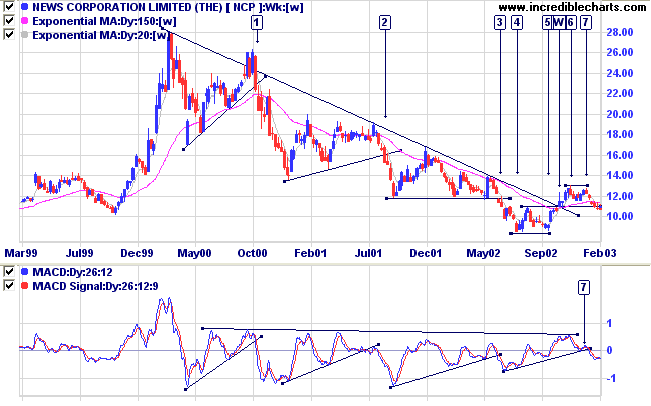
News Corporation [NCP]
Last covered on February 10, 2003.
The most significant stock in the Consumer Discretionary sector, NCP completed a double bottom at [4] and [5] after a long stage 4 down-trend. The long-term trendline was broken at [W] which also completed the double bottom. The stock then rallied to a high at [6] but failed to exceed this, with a lower high at [7] and then completed a double top pattern, signaling trend reversal. The stock is currently testing the 11.00 support level.
Relative Strength (price ratio: xao) is weakening, Twiggs Money Flow signals distribution and MACD is bearish.
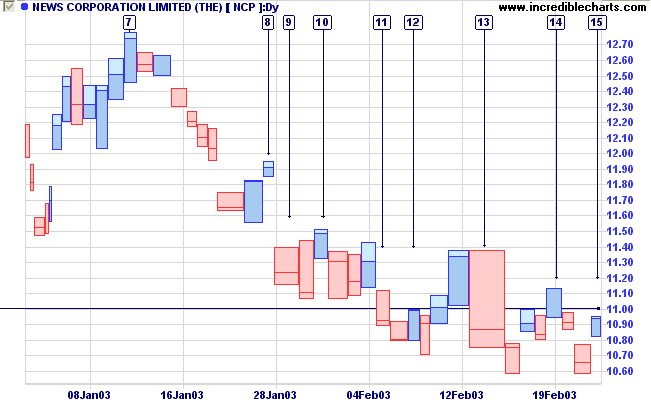
Equivolume shows how price initially broke below support at [11].
The pull-back to [13] displayed fair volume but the primary trend
move back below 11.00 was far stronger [13]. Volume has dried up
on subsequent pull-backs, at [14] and [15], and price appears
likely to respect the 11.00 resistance level.
A break below the low of 10.58 will be a strong bear signal, signaling a likely re-test of support at 8.50 (from [4] and [5] on the weekly chart).
A break below the low of 10.58 will be a strong bear signal, signaling a likely re-test of support at 8.50 (from [4] and [5] on the weekly chart).
Market strategy
For further guidance see Understanding the Trading Diary.
For further guidance see Understanding the Trading Diary.
Short-term: Short if the All Ords falls below 2800. Slow
Stochastic and MACD are below their respective signal lines.
Medium-term: Avoid new entries.
Long-term: Wait for confirmation of the
bottom reversal signal.
Colin Twiggs
Beware of little expenses.
A small leak will sink a great ship.
- Benjamin Franklin
Back Issues
Click here to access the
Trading Diary Archives.
Back Issues
Access the Trading Diary Archives.