Full Member Version
We are making good progress
and will announce a start date shortly.
One area that is likely to be delayed is dividend data
- we have to find another data supplier due to reliability issues.
Trading Diary
February 21, 2003
These extracts from my daily trading diary are
intended to illustrate the techniques used in short-term trading
and should not be interpreted as investment advice. Full terms
and conditions can be found at Terms
of Use .
USA
The Dow gained 1.3% to close at 8018 on strong
volume. A rise above 8114 will signal that the short-trend
is up.
The next support level is 7500.
The primary trend is down.
The Nasdaq Composite closed 18 points up at 1349. The congestion signals uncertainty.
The primary trend is up.
Several readers have queried the direction of the Nasdaq primary trend and I am sure that many hold the view that the trend is down. This depends on the criteria used to identify secondary corrections in terms of Dow theory:
(1) minimum number of weeks?
(2) minimum retracement of primary trend move?
(3) minimum % price move?
I use (1) 3 weeks, and either (2) 1/3 or (3) 10% as the minimum requirement for a secondary correction. If you use only (1) and (2), you end up with a different result.
Whether the reaction in July/August 2002 qualifies as a secondary correction is a gray area. The only proof is in the outcome: will the index fall below 1108 or rise above 1521? Until then it is counter-productive to keep changing one's analysis in accordance with the short-term emotional swings of the market.
The S&P 500 gained 11 points to close at 848, forming an outside day. The current congestion signals uncertainty.
The next support level is at 768.
The primary trend is down.
The Chartcraft NYSE Bullish % Indicator is at 42% (February 20).
As clear as ....
The market faces an uncertain two weeks, with the release of key economic indicators and continuing tensions over Iraq. (more)
The market faces an uncertain two weeks, with the release of key economic indicators and continuing tensions over Iraq. (more)
Gold
New York (16.00): Spot gold closed 120 cents down at $US 350.70.
New York (16.00): Spot gold closed 120 cents down at $US 350.70.
ASX Australia
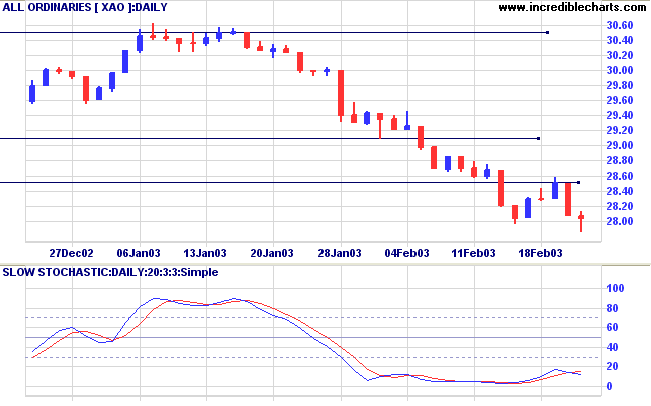
The All Ordinaries shows a dragonfly doji, signaling a short-term
reversal, after closing 3 points down at 2804 on average
volume.
The next support level is at 2779 (from October 1999).
Slow Stochastic (20,3,3) has crossed below its signal line; MACD (26,12,9) is below. Twiggs Money Flow again crossed above its trendline.
The next support level is at 2779 (from October 1999).
Slow Stochastic (20,3,3) has crossed below its signal line; MACD (26,12,9) is below. Twiggs Money Flow again crossed above its trendline.
Sector Analysis
Changes are highlighted in bold.
Changes are highlighted in bold.
- Energy [XEJ] - stage 4 (RS is rising)
- Materials [XMJ] - stage 2 (RS is rising)
- Industrials [XNJ] - stage 4 (RS is falling)
- Consumer Discretionary [XDJ] - stage 1 (RS is level)
- Consumer Staples [XSJ] - stage 4 (RS is rising)
- Health Care [XHJ] - stage 4 (RS is falling)
- Property Trusts [XPJ] - stage 2 (RS is rising)
- Financial excl. Property Trusts [XXJ] - stage 4 (RS is falling)
- Information Technology [XIJ] - stage 4 (RS is level)
- Telecom Services [XTJ] - stage 4 (RS is level)
- Utilities [XUJ] - stage 2 (RS is rising)
Sectors: Relative Strength
A stock screen of the ASX 200 using % Price Move (1 month: +5%) returned 20 stocks (compared to 99, August 23rd and 10 on October 4th).
Four of the stocks were from Construction Materials.
A stock screen of the ASX 200 using % Price Move (1 month: +5%) returned 20 stocks (compared to 99, August 23rd and 10 on October 4th).
Four of the stocks were from Construction Materials.

Market strategy
For further guidance see Understanding the Trading Diary.
For further guidance see Understanding the Trading Diary.
Short-term: Short if the All Ords falls below 2800. Slow
Stochastic and MACD are below their respective signal lines.
Medium-term: Avoid new entries.
Long-term: Wait for confirmation of the
bottom reversal signal.
Colin Twiggs
A good general does not keep changing his
mind
but sticks to his chosen course of action,
until faced with clear evidence that it is wrong.
- Claus von Clausewitz: translated from Vom Kriege "On War"
(1831)
Back Issues
Click here to access the
Trading Diary Archives.
Back Issues
Access the Trading Diary Archives.