2003 Membership
The reduced subscription to existing members
will run for at least 4 weeks
after all the data is in place and the free trial commences.
Subscription/Registration forms will be available from the start of the free trial period.
We will keep you informed of progress.
after all the data is in place and the free trial commences.
Subscription/Registration forms will be available from the start of the free trial period.
We will keep you informed of progress.
Trading Diary
February 11, 2003
These extracts from my daily trading diary are
intended to illustrate the techniques used in short-term trading
and should not be interpreted as investment advice. Full terms
and conditions can be found at Terms
of Use .
USA
The Dow lost 1% to close at 7843 on average
volume, creeping towards the 7500 support level.
The primary trend is down.
The Nasdaq Composite closed 1 point down at 1295.
The next major support level is at 1200.
The primary trend is up (the last low was 1108, the last high 1521).
The S&P 500 eased 6 points to close at 829.
The index has formed a base between 768 and 964 but appears headed for a re-test of the support level.
The Chartcraft NYSE Bullish % Indicator dropped to 44% (February 10).
Iraq
Qatar-based Al-Jazeera network aired an audiotape purporting to be from Osama bin Laden. (more)
Qatar-based Al-Jazeera network aired an audiotape purporting to be from Osama bin Laden. (more)
Greenspan
Federal Reserve Chairman Alan Greenspan stresses the need for budget discipline and says that tax cuts should only be passed if other revenue is found to replace it. (more)
Back Issues
Federal Reserve Chairman Alan Greenspan stresses the need for budget discipline and says that tax cuts should only be passed if other revenue is found to replace it. (more)
Gold
New York (16.00): Spot gold is up 120 cents at $US 363.50.
New York (16.00): Spot gold is up 120 cents at $US 363.50.
ASX Australia
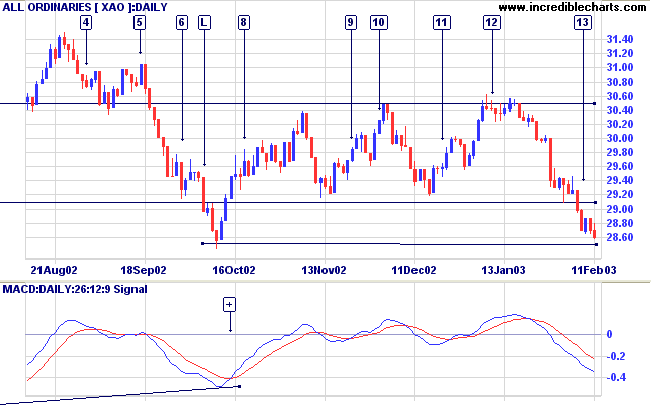
The All Ordinaries closed down a further 10 points at 2860
on average volume.
The index is fast approaching a major support level, with a strong band of support between 2850 and 2779.
Slow Stochastic (20,3,3) is above its signal line; MACD (26,12,9) is below; Twiggs Money Flow signals distribution.
The index is fast approaching a major support level, with a strong band of support between 2850 and 2779.
Slow Stochastic (20,3,3) is above its signal line; MACD (26,12,9) is below; Twiggs Money Flow signals distribution.
Challenger International
[CLI]
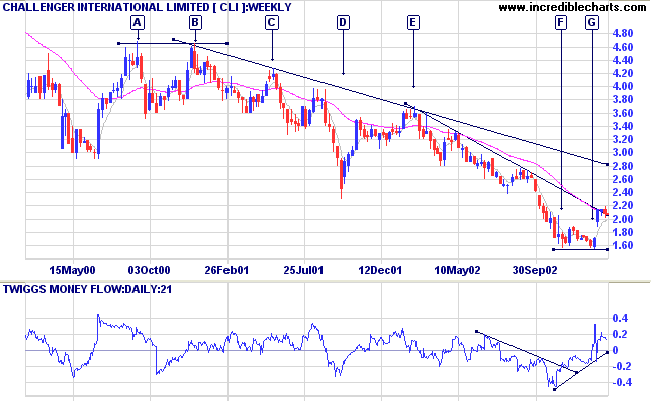
Many stocks in the Diversified Financials industry group have been punished by the market over the last two years and CLI was not spared. The stock completed a double top at [A] and [B] followed by a stage 4 down-trend. At the end of last year CLI made a sharp reversal, forming a double bottom at [F] and [G] completed with a strong gap above the resistance level.
Twiggs Money Flow signals accumulation; MACD and Relative Strength (price ratio: xao) are rising.
However, the base is narrow and we should be alert to possible failure.
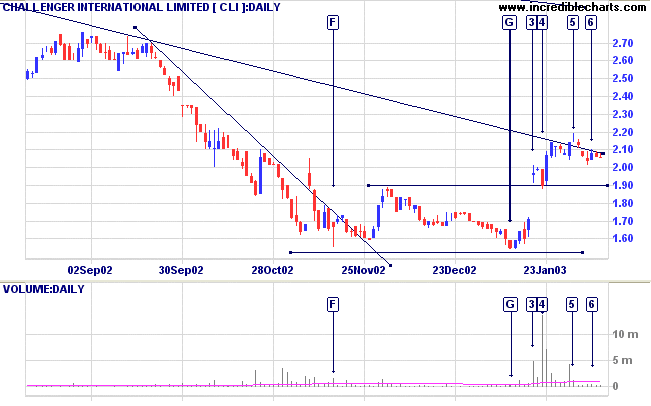
The daily chart shows the double bottom at [F] and [G]
(note how volume has dried up at [G]). The breakaway gap
at [3] is accompanied by strong volume and the pull-back
[4] held above the 1.90 support level, both bullish
signals. But strong volume at [4] signals profit-taking
by sellers. Volume proceeded to dry up and the new high
at [5] showed no real commitment. Volume on the
subsequent pull-back has dried up even further, a bullish
sign.
CLI appears to be having difficulty breaking above the long-term trendline.
CLI appears to be having difficulty breaking above the long-term trendline.
The breakout is weak. Wait for further confirmation
before going long. For example: price respecting the
long-term trendline and/or the 1.90 support level, from
above.
Market strategy
For further guidance see Understanding the Trading Diary.
For further guidance see Understanding the Trading Diary.
Short-term: Avoid new entries. Slow Stochastic and MACD
are on opposite sides of their respective signal lines.
Medium-term: Avoid new entries.
Long-term: Wait for confirmation of the
bottom reversal signal.
Colin Twiggs
Do not be desirous of having things
done quickly.
Do not look at small advantages.
Desire to have things done quickly prevents their being
done thoroughly.
Looking at small advantages prevents great
affairs from being accomplished.
- The Analects of
Confucius
Back Issues
Click here to access the
Trading Diary Archives.
Back Issues
Access the Trading Diary Archives.