2003 Membership
The reduced subscription to existing members
will run for at least 4 weeks
after all the data is in place and the free trial commences.
Subscription/Registration forms will be available from the start of the free trial period.
We will keep you informed of progress.
after all the data is in place and the free trial commences.
Subscription/Registration forms will be available from the start of the free trial period.
We will keep you informed of progress.
Trading Diary
February 7, 2003
These extracts from my daily trading diary are
intended to illustrate the techniques used in short-term trading
and should not be interpreted as investment advice. Full terms
and conditions can be found at Terms
of Use .
USA
The Dow has broken out below the recent
congestion pattern, closing down 0.8% at 7864 on average
volume.
The index appears headed for a re-test of support at 7500.
The primary trend is down.
The Nasdaq Composite closed down 19 points at 1282; the next major support level is at 1200.
The primary trend is up (the last low was 1108, the last high 1521).
The S&P 500 closed down 9 points at 829.
The index formed a base between 768 and 964 but appears headed for a re-test of the support level.
The Chartcraft NYSE Bullish % Indicator remains at 46% (February 6).
Unemployment falls
The jobless rate fell to 5.7%, from 6.0% in December, but economists ascribe this to seasonal influences. (more)
Back Issues
The jobless rate fell to 5.7%, from 6.0% in December, but economists ascribe this to seasonal influences. (more)
Gold
New York (17.00): Spot gold closed at $US 369.30.
New York (17.00): Spot gold closed at $US 369.30.
ASX Australia
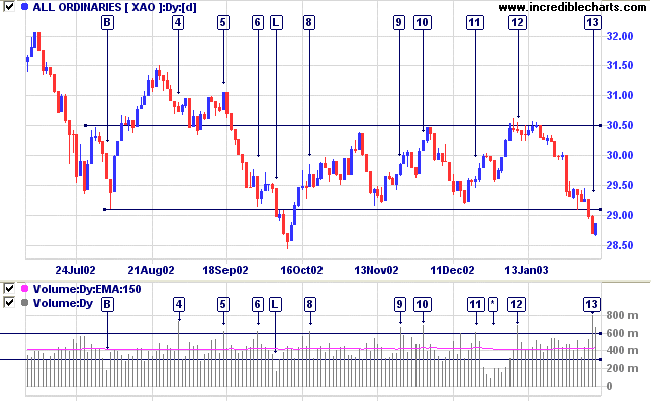
The All Ordinaries recovered 18 points to close at 2886 on
strong volume, above the 2850 support level.
Slow Stochastic (20,3,3) is below its signal line; MACD (26,12,9) is below; Twiggs Money Flow signals distribution.
Slow Stochastic (20,3,3) is below its signal line; MACD (26,12,9) is below; Twiggs Money Flow signals distribution.
Croesus Mining NL [CRS]
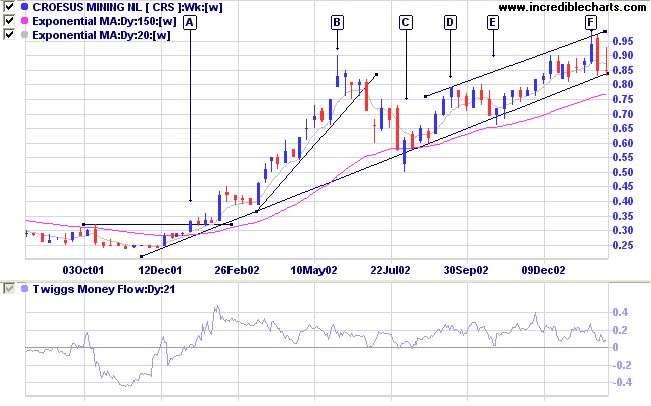
Croesus started a stage 2 up-trend at [A] but then accelerated into a spike at [B]. There was a secondary reaction to [C] before the stock established a fast trend channel.
Relative Strength (price ratio:xao) is rising; Twiggs Money Flow has signaled accumulation for more than a year; and MACD is positive.
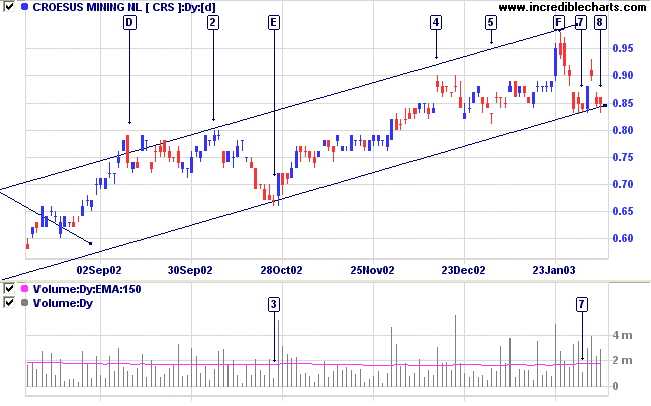
The daily chart shows entry opportunities at [E] and [7],
where both volume and range dried up at the supporting
trendline. Entries can be taken using a buy-stop above the
high of the signal day, with stop-losses below the
short-term lows.
CRS now appears to be forming an equal low at [8]; a strong bull signal in an up-trend. There may be further entry points in the days ahead.
CRS now appears to be forming an equal low at [8]; a strong bull signal in an up-trend. There may be further entry points in the days ahead.
Sector Analysis
Changes are highlighted in bold.
Changes are highlighted in bold.
- Energy [XEJ] - stage 4 (RS is level)
- Materials [XMJ] - stage 2 (RS is rising)
- Industrials [XNJ] - stage 4 (RS is rising)
- Consumer Discretionary [XDJ] - stage 2 (RS is rising)
- Consumer Staples [XSJ] - stage 4 (RS is rising)
- Health Care [XHJ] - stage 1 (RS is level)
- Property Trusts [XPJ] - stage 2 (RS is rising)
- Financial excl. Property Trusts [XXJ] - stage 4 (RS is falling)
- Information Technology [XIJ] - stage 4 (RS is level)
- Telecom Services [XTJ] - stage 4 (RS is falling)
- Utilities [XUJ] - stage 2 (RS is rising)
Sectors: Relative Strength
A stock screen of the ASX 200 using % Price Move (1 month: +5%) returned 17 stocks (compared to 99, August 23rd and 10 on October 4th).
There were no prevalent sectors.
A stock screen of the ASX 200 using % Price Move (1 month: +5%) returned 17 stocks (compared to 99, August 23rd and 10 on October 4th).
There were no prevalent sectors.
Market strategy
For further guidance see Understanding the Trading Diary.
For further guidance see Understanding the Trading Diary.
Short-term: Short if the All Ords falls below 2864. Slow
Stochastic and MACD are below their respective signal
lines.
Medium-term: Avoid new entries.
Long-term: Wait for confirmation of the
bottom reversal signal.
Colin Twiggs
We should be careful to get out of an
experience only the wisdom that is in it - and stop
there;
lest we be like the cat that sits down on a hot
stove-lid.
She will never sit down on a hot stove-lid again,
and that is well;
but also she will never sit down on a cold one
anymore.
- Samuel Clemens (1835 -
1910)
Back Issues
Click here to access the
Trading Diary Archives.
Back Issues
Access the Trading Diary Archives.