2003 Membership
The reduced subscription to existing members
will run for at least 4 weeks
after all the data is in place and the free trial commences.
Subscription/Registration forms will be available from the start of the free trial period.
We will keep you informed of progress.
after all the data is in place and the free trial commences.
Subscription/Registration forms will be available from the start of the free trial period.
We will keep you informed of progress.
Trading Diary
January 29, 2003
These extracts from my daily trading diary are
intended to illustrate the techniques used in short-term trading
and should not be interpreted as investment advice. Full terms
and conditions can be found at Terms
of Use .
USA
The Dow formed an outside day, closing up 0.3%
at 8110 on higher volume. The index appears headed for a re-test
of the 7500 support level.
The primary trend is down.
The Nasdaq Composite rallied 1.2% to close at 1358. The next major support level is at 1200.
The primary trend is up.
The S&P 500 rallied 6 points to close at 864. The index appears headed for a re-test of support at 768.
The Chartcraft NYSE Bullish % Indicator is on a bull correction signal at 48% (January 27).
Federal Reserve Board
The Fed policy meeting left the fed funds rate unchanged at 1.25% and sees "balanced" risks to the economy. (more)
Slow Stochastic (20,3,3) and MACD (26,12,9) are below their signal lines; Twiggs Money Flow signals distribution.
Back Issues
The Fed policy meeting left the fed funds rate unchanged at 1.25% and sees "balanced" risks to the economy. (more)
Gold
New York (16:15): Spot gold fell sharply to $US 365.80.
New York (16:15): Spot gold fell sharply to $US 365.80.
ASX Australia
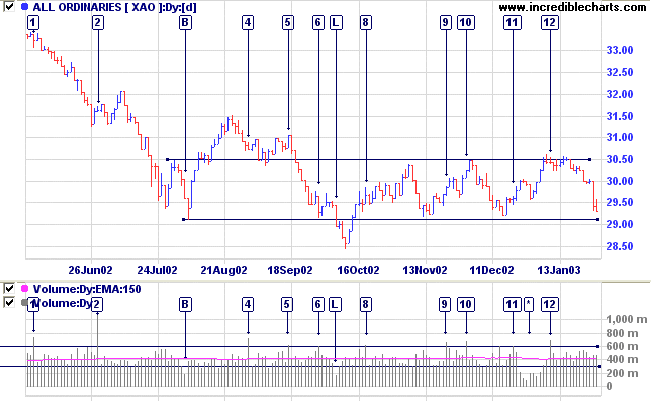
The rapid fall on the All Ordinaries has eased somewhat, with
the index closing down 11 points at 2930 on average
volume.
There has been some useful discussion on the Forum as to whether the 2915 to 3050 trading range is a valid base. This is especially relevant as the 2915 support level is likely to be severely tested over the next few days.
Stan Weinstein describes a base as an area where price moves sideways and the stage 4 decline loses momentum ....sellers and buyers move into equilibrium .....volume dries up as the base forms....... but may later expand.
The daily chart highlights volume spikes (above 600m) and
days with exceptionally low volume (below 300m):
- The low days all occurred over the festive season or on NSW holidays.
- The breakout at [L] occurred on exceptionally low volume, on Labor Day, October 7, and lacked conviction, retreating back above 2915.
- Subsequent volume spikes from [8] to [11] all occurred on up-days.
- However, [12] is on a down-day; threatening support at 2915.
Slow Stochastic (20,3,3) and MACD (26,12,9) are below their signal lines; Twiggs Money Flow signals distribution.
News Corporation [NCP]
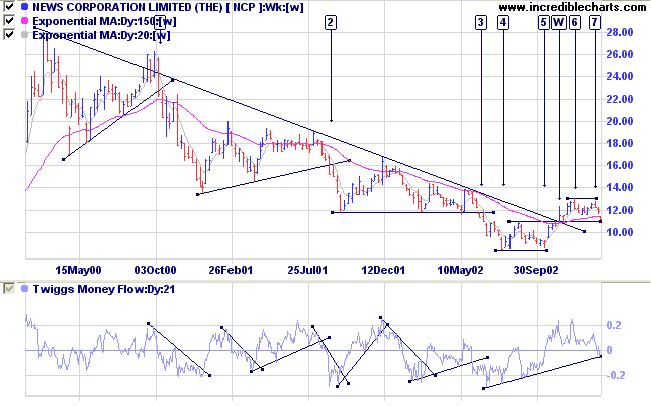
Last covered on January 21, 2003.
NCP completed a double bottom at [4] and [5] with a breakout at [W].
Since then the stock has formed a double top at [6] and [7].
Relative Strength (price ratio: xao) is neutral; MACD is bearish; and Twiggs Money Flow signals distribution after breaking below its trendline.
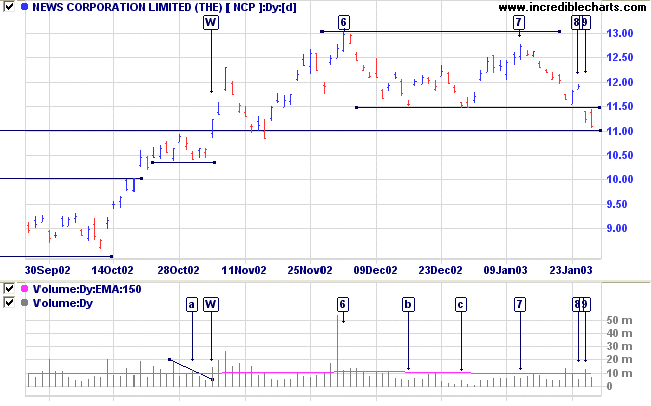
The daily chart shows that price respected the new support
level after the breakout at [W] and then rallied to [6].
The two subsequent troughs at [b] and [c] were on low
volume. These were then followed by a lower high at [7],
still on low volume. NCP again respected the support level
at 11.50 but volume dried up on the rally at
[8].
Price then gapped down below the support level, at [9], with increasing volume. This completes the double top pattern from [6] and [7], with a target of 10.00.
Price then gapped down below the support level, at [9], with increasing volume. This completes the double top pattern from [6] and [7], with a target of 10.00.
A break below 11.00 will be a bear signal and may mean a
re-test of support at 8.50.
Market strategy
For further guidance see Understanding the Trading Diary.
For further guidance see Understanding the Trading Diary.
Short-term: Short. The Slow Stochastic and MACD are below
their respective signal lines.
Medium-term: Avoid new entries.
Long-term: Wait for confirmation of the
bottom reversal signal.
Colin Twiggs
We have got but one life here.
It pays, no matter what comes after it,
to try and do things, to accomplish things in this life
and not merely to have a soft and pleasant time.
- Theodore Roosevelt
It pays, no matter what comes after it,
to try and do things, to accomplish things in this life
and not merely to have a soft and pleasant time.
- Theodore Roosevelt
Back Issues
Click here to access the
Trading Diary Archives.
Back Issues
Access the Trading Diary Archives.