Chart Forum: Private Messages
When replying to a private message received from the Chart Forum:
-
Click on the link below the message:
If you would like to reply to this message by sending a private message of your own through the discussion board, use the following link to send your reply:
https://forum.incrediblecharts.com/userscripts/forums/board-profile.plx?action=sendmsg&to=colin_twiggs&db=1
-
Do not use the normal Reply button in your
Email program - this will not reach the intended
recipient.
Trading Diary
December 04, 2002
These extracts from my daily trading diary are
intended to illustrate the techniques used in short-term trading
and should not be interpreted as investment advice. Full terms
and conditions can be found at Terms
of Use .
USA
The Dow closed almost unchanged at 8737 on
higher volume. The index continues in a creeping up-trend.
The primary trend is still down. It will reverse up if the average rises above 9130.
The Nasdaq Composite index gapped down further to close 1.3% down at 1430.
The primary trend is up (the index is above 1426).
The S&P 500 closed down 3 points at 917.
The primary trend will complete a double bottom reversal if it rises above 965.
The Chartcraft NYSE Bullish % Indicator signals a bull alert at 50% (December 03).
Back Issues
The primary trend is still down. It will reverse up if the average rises above 9130.
The Nasdaq Composite index gapped down further to close 1.3% down at 1430.
The primary trend is up (the index is above 1426).
The S&P 500 closed down 3 points at 917.
The primary trend will complete a double bottom reversal if it rises above 965.
The Chartcraft NYSE Bullish % Indicator signals a bull alert at 50% (December 03).
Gold
New York: Spot gold is up 150 cents to $US 321.90.
New York: Spot gold is up 150 cents to $US 321.90.
ASX Australia
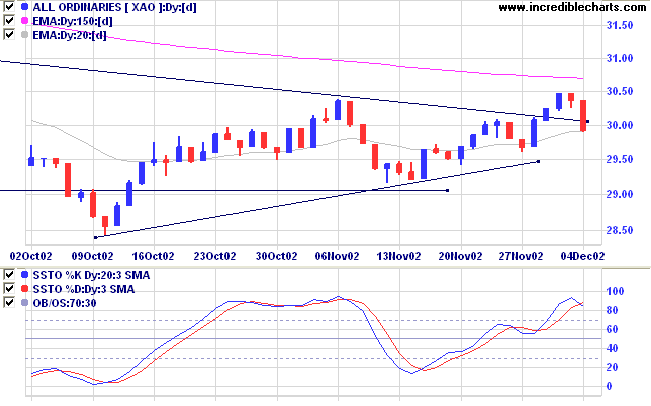
The All Ordinaries dropped sharply to close at 2993 on lower
volume. The latest counter-trend has retraced more than either
of the two previous pull-backs, signaling trend weakness.
The primary trend will reverse (up) if the index rises above 3150.
The Slow Stochastic (20,3,3) has crossed below its signal line; MACD (26,12,9) is above; Twiggs money flow signals accumulation.
The primary trend will reverse (up) if the index rises above 3150.
The Slow Stochastic (20,3,3) has crossed below its signal line; MACD (26,12,9) is above; Twiggs money flow signals accumulation.
Adelaide Brighton Cement [ABC]
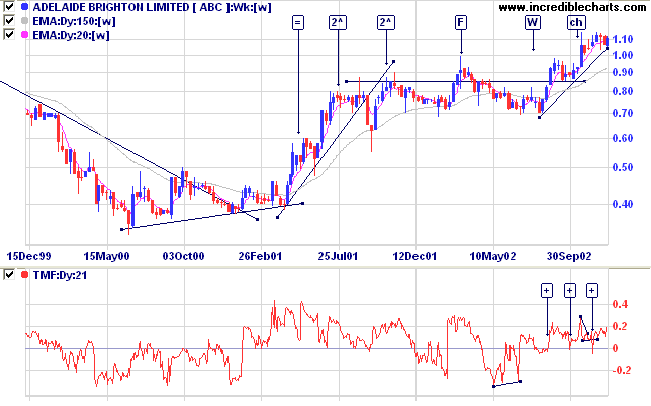
After a strong rally in the first half of 2001, ABC entered a period of consolidation, failing to hold a new high at [F], before establishing a base at 0.70 [W]. A cup and handle pattern is visible at [F] to [ch].
Relative strength (price ratio: xao) is rising, as is MACD. Twiggs money flow shows strong accumulation.
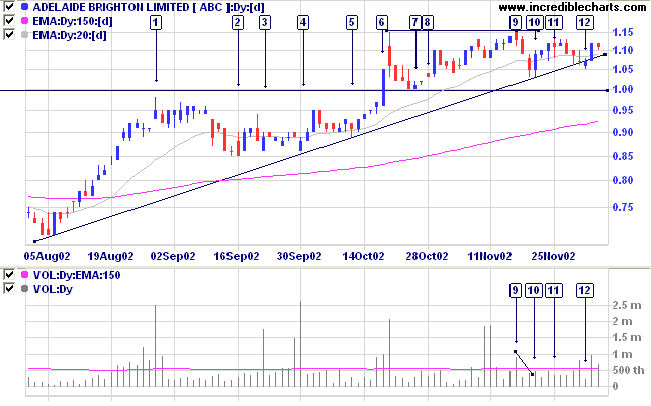
On the daily chart ABC re-tested resistance at [9] before a
strong counter-trend, breaking the series of higher lows
between [7] and [9]. Price confirmed the trendline at [10]
before a weak rally to [11] on low volume. The next
counter-trend managed to break the trendline at [12] but volume
was low and the stock rallied back on higher volume. A false
break of a trendline can be used as an entry point by
short-term traders: placing a buy stop above the high of [12]
when they see that volume has dried up. The next entry point
will be if ABC re-tests resistance at 1.15: entries can be
taken just above 1.15 with a stop just below or, if there is a
weak pull-back below the resistance level, off the high of the
lowest day in the pull-back, with a stop below the low.
Market strategy
For further guidance see Understanding the Trading Diary.
For further guidance see Understanding the Trading Diary.
Short-term: Avoid new entries. The Slow Stochastic and MACD are
on opposite sides of their respective signal lines.
Medium-term: Avoid new entries.
Long-term: Wait for confirmation of the
bottom reversal signal.
Colin Twiggs
He who controls others may be
powerful,
but he who has mastered himself is mightier still.
- Lao Tse.
but he who has mastered himself is mightier still.
- Lao Tse.
Back Issues
Click here to access the
Trading Diary Archives.
Back Issues
Access the Trading Diary Archives.

Author: Colin Twiggs is a former investment banker with almost 40 years of experience in financial markets. He co-founded Incredible Charts and writes the popular Trading Diary and Patient Investor newsletters.
Using a top-down approach, Colin identifies key macro trends in the global economy before evaluating selected opportunities using a combination of fundamental and technical analysis.
Focusing on interest rates and financial market liquidity as primary drivers of the economic cycle, he warned of the 2008/2009 and 2020 bear markets well ahead of actual events.
He founded PVT Capital (AFSL No. 546090) in May 2023, which offers investment strategy and advice to wholesale clients.