Incredible Charts version 4.0.0.5
To be released this weekend, the new version offers:
-
A Price Ratio (relative strength) indicator
that can apply to all securities in a project.
When installing on the Indicator Panel, select "Apply to Project".
-
New Stock Screens
- Directional Movement (+DI, -DI and ADX)
- MACD above or below zero
- Volume Filter
- Equivolume with closing prices
Trading Diary
October 03, 2002
These extracts from my daily trading diary are
intended to illustrate the techniques used in short-term trading
and should not be interpreted as investment advice. Full terms
and conditions can be found at Terms
of Use .
USA
The Dow rallied at the opening but just as quickly fell back to
close 0.5% down at 7717 on strong volume.
The primary trend is down.
The Nasdaq Composite Index declined 1.8% to close at 1165.
The primary trend is down.
The S&P 500 lost 9 points to close at 818.
The primary trend is down.
The Chartcraft NYSE Bullish % Indicator reflects a bear confirmed signal at 32% (October 2).
The primary trend is down.
The Nasdaq Composite Index declined 1.8% to close at 1165.
The primary trend is down.
The S&P 500 lost 9 points to close at 818.
The primary trend is down.
The Chartcraft NYSE Bullish % Indicator reflects a bear confirmed signal at 32% (October 2).
Financial stocks down
Concerns over bad loan increases triggered a decline in bank stocks. (more)
Back Issues
Concerns over bad loan increases triggered a decline in bank stocks. (more)
Gold
New York: The latest spot gold price was down 210 cents at $US 321.00.
New York: The latest spot gold price was down 210 cents at $US 321.00.
ASX Australia
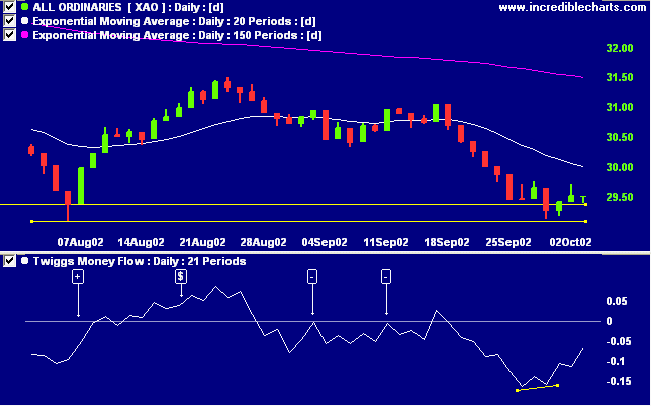
After an early fall, the All Ordinaries index made several
attempts to break above the previous close, ending unchanged at
2952 on average volume.
Slow Stochastic (20,3,3) is above its signal line, while MACD (26,12,9) is below. Twiggs money shows a small bullish divergence.
The primary trend is down.
Slow Stochastic (20,3,3) is above its signal line, while MACD (26,12,9) is below. Twiggs money shows a small bullish divergence.
The primary trend is down.
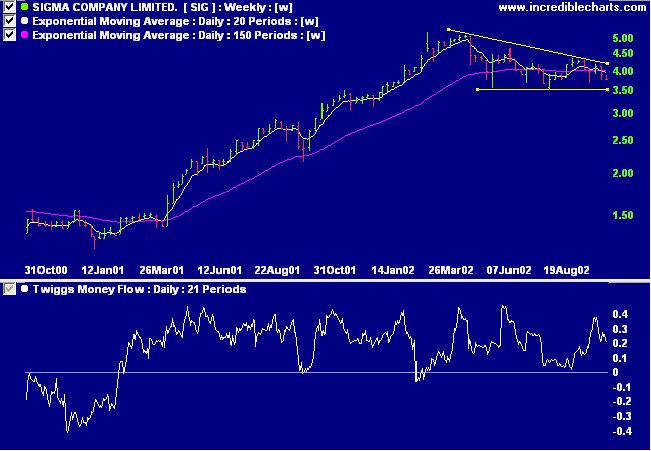
Sigma [SIG]
The pharmacy group has entered a stage 3 top, after a strong up-trend. The top has taken the form of a declining triangle, normally a bearish pattern. Twiggs money flow, however, reveals strong accumulation over the past 18 months.
The pharmacy group has entered a stage 3 top, after a strong up-trend. The top has taken the form of a declining triangle, normally a bearish pattern. Twiggs money flow, however, reveals strong accumulation over the past 18 months.
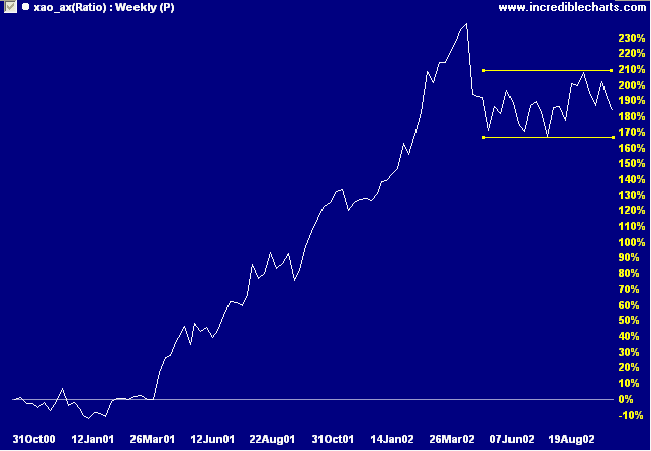
Relative strength (price ratio: xao) is ranging within a narrow
band, after falling from its April peak.
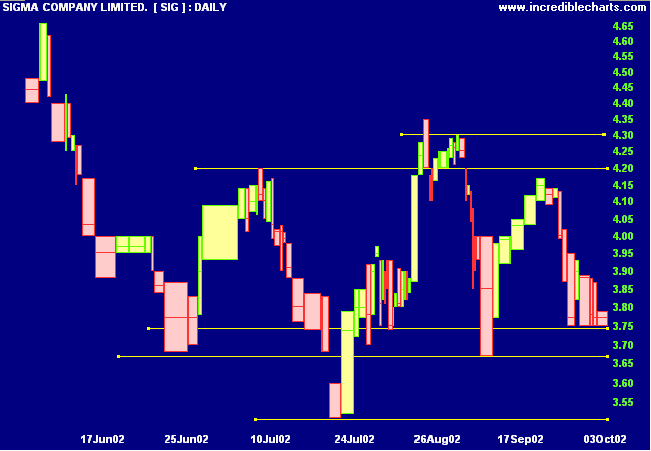
At present SIG is holding above support at 3.75. Support and
resistance levels can be seen on the daily equivolume chart.
The shaded areas depict closing prices, with the lighter shade
above the close in an up-trend, and below the close in a
down-trend.
Worth watching: a fall below 3.50 will be a strong bear signal, but a rally above 4.30 will signal the return of the bulls.
Worth watching: a fall below 3.50 will be a strong bear signal, but a rally above 4.30 will signal the return of the bulls.
Short-term: Avoid new entries. The Slow Stochastic and MACD are
on opposite sides of their respective signal lines.
Medium-term: Wait for the All Ords to signal a reversal.
Long-term: Wait for a bull-trend on the Nasdaq or S&P 500
(primary cycle).
Colin Twiggs
Thought for the Day:
There is a time for all things, but I didn't know it. And that is precisely what beats so many men in Wall Street who are very far from being in the main sucker class. There is the plain fool, who does the wrong thing at all times everywhere,
but there is the Wall Street fool, who thinks he must trade all the time.
- Edwin Lefevre
Back Issues
Click here to access the
Trading Diary Archives.
Back Issues
Access the Trading Diary Archives.