Secondary Cycle Movements*
On August 15 the Dow broke above resistance at 8800. The magnitude of the earlier swings, from 7500 to 8800 and back to 8000, were large enough for them to be considered as secondary movements but the duration of the second correction (to 8000) proved too short for it to be considered as a separate cycle. This is more evident on a weekly chart. I had earlier stated that a break above 8800 would signal a reversal and my failure to explain must have confused readers.
A secondary cycle correction normally lasts from 3 weeks to 6 months and:
- Retraces at least 1/3 of the previous rally;
- Or has a magnitude of at least 10%;
- Unless it takes the form of a ranging market.
Trading Diary
August 23, 2002
These extracts from my daily trading diary are
intended to illustrate the techniques used in short-term trading
and should not be interpreted as investment advice. Full terms
and conditions can be found at Terms
of Use .
USA
The Dow closed down 2% at 8872. The lower volume is a positive
sign.
The primary cycle is in a down-trend*.
The primary cycle is in a down-trend*.
The Nasdaq Composite descended 3% to close at 1380. The primary cycle is in a down-trend.
The S&P 500 lost 22 points to close at 940. The primary cycle is in a down-trend.
The Chartcraft NYSE Bullish % Indicator bull alert signal is at 44% (August 22).
AOL
The SEC is investigating more than $US 500 million in stock sales by AOL executives, while the company was making upbeat forecasts and supporting aggressive earnings estimates. (more)
The SEC is investigating more than $US 500 million in stock sales by AOL executives, while the company was making upbeat forecasts and supporting aggressive earnings estimates. (more)
Chip and hardware stocks slide
Slow PC sales weaken Intel, AMD and hardware stocks. (more)
Slow PC sales weaken Intel, AMD and hardware stocks. (more)
ASX Australia
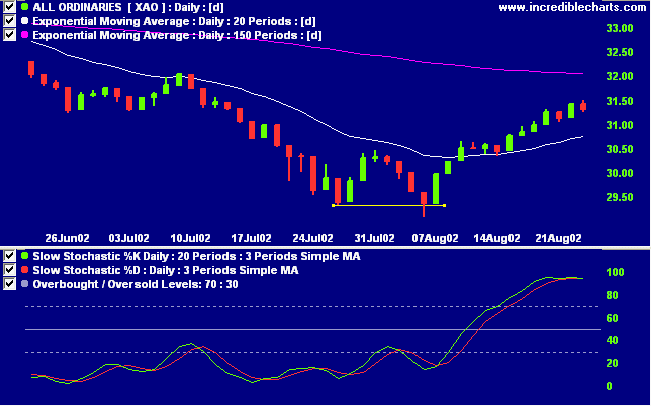
The All Ordinaries eased 10 points to close at 3133 on strong
volume.
The primary cycle trends down.
The primary cycle trends down.
The Stochastic (20,3,3) has crossed below its signal line. Twiggs
money flow signals accumulation.
Billabong surge on export sales [BBG]
Strong results in the US and Europe boost Billabong annual profits by 45%. (more)
Strong results in the US and Europe boost Billabong annual profits by 45%. (more)
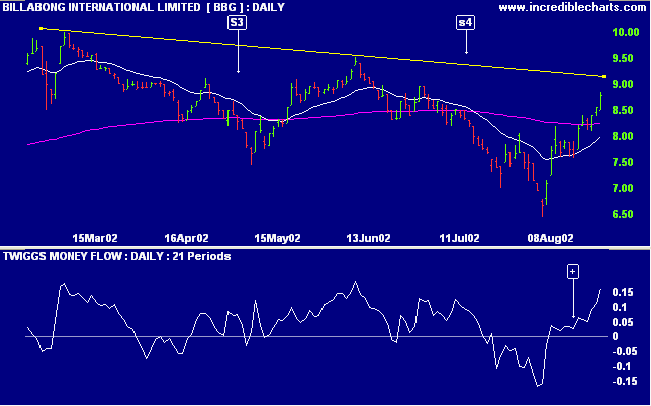
BBG recently signaled a stage 4 decline but is now forming a
rally to test the trend. Relative strength (price ratio: xao) has
leveled off after a strong up-trend.
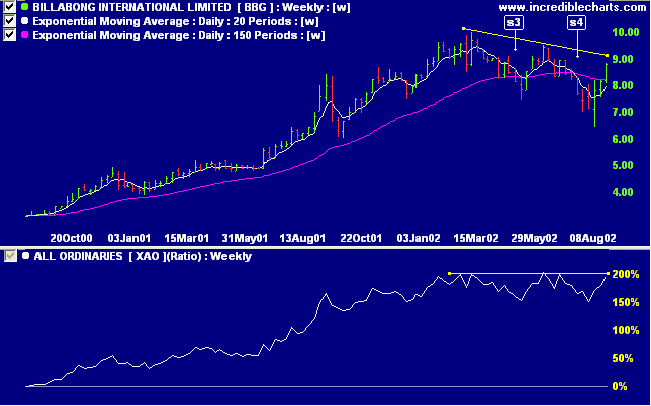
MACD and Twiggs money flow are positive.
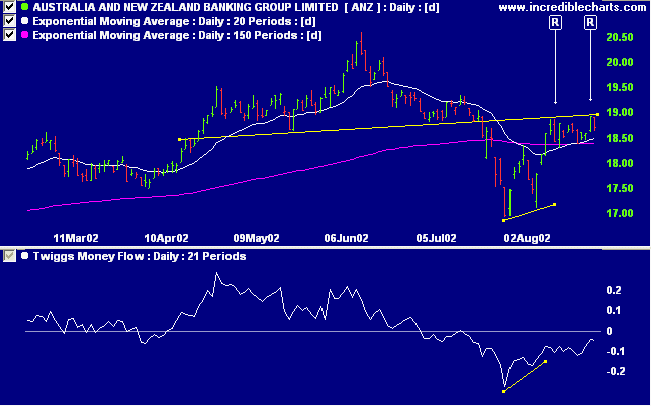
ANZ Bank [ANZ]
ANZ completed a head and shoulders reversal in July and has twice since then respected [R] the neckline. Relative strength (price ratio: xao) and MACD are positive while Twiggs money flow is rising but still below zero.
ANZ completed a head and shoulders reversal in July and has twice since then respected [R] the neckline. Relative strength (price ratio: xao) and MACD are positive while Twiggs money flow is rising but still below zero.
Sector Analysis
Stage changes are highlighted in bold.
Stage changes are highlighted in bold.
- Energy [XEJ] - stage 1 (RS is rising)
- Materials [XMJ] - stage 4
- Industrials [XNJ] - stage 4
- Consumer Discretionary [XDJ] - stage 4
- Consumer Staples [XSJ] - stage 4 (RS is rising)
- Health Care [XHJ] - stage 4
- Property Trusts [XPJ] - stage 4
- Financial excl. Property Trusts [XXJ] - stage 4
- Information Technology [XIJ] - stage 4
- Telecom Services [XTJ] - stage 1
- Utilities [XUJ] - stage 2 (RS is rising)
Sectors: Relative Strength
A stock screen of the ASX 200 using % Price Move (1 month: +5%) is teeming with stocks that have gained more than 5% in the last month (99 in total). Notably:
A stock screen of the ASX 200 using % Price Move (1 month: +5%) is teeming with stocks that have gained more than 5% in the last month (99 in total). Notably:
- Banks
- Oil & Gas
Conclusion
Short-term: Avoid new entries. Slow Stochastic and MACD are on
opposite sides of their respective signal lines.
Medium-term: Wait for the All Ords to signal a reversal (a
correction that finishes above the previous trough followed by a
high above the last peak).
Long-term: Wait for a bull-trend on the Nasdaq or S&P 500
(primary cycle).
Colin Twiggs
Thought for the Day:
All you need to succeed in life are common sense and self-discipline.
- Alf Blackbeard
All you need to succeed in life are common sense and self-discipline.
- Alf Blackbeard
Back Issues
Click here to access the
Trading Diary Archives.
Back Issues
Access the Trading Diary Archives.