More signs of risk avoidance
By Colin Twiggs
February 8, 2019 6:30 a.m. ET (10:30 p.m. AEDT)
First, please read the Disclaimer.
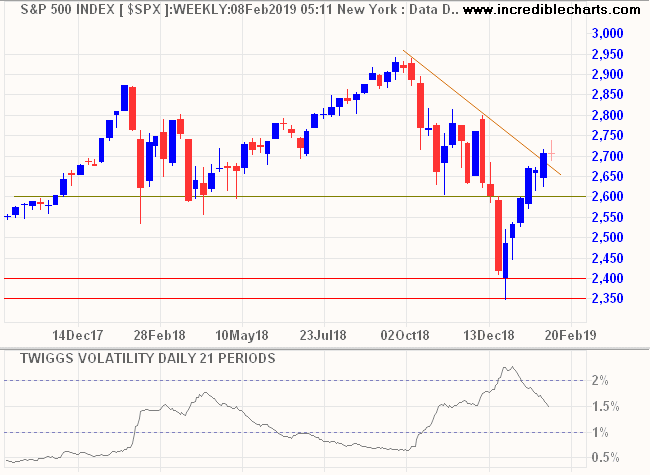
Bloomberg: "U.S. stocks slid as investors grew anxious that the Trump administration won't reach a trade deal with China before a March deadline for escalating the war. Treasuries surged.
The post-Christmas rally that added 16 percent to the S&P 500 came under increasing pressure amid reports the two trading partners remained far apart on a deal and that the nations' presidents won't meet before higher tariffs are slated to take effect on Chinese goods next month."
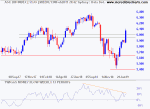
S&P 500 volatility remains high. If the rally runs out of steam, a large Twiggs Volatility (21-day) trough above 1.0% would signal a bear market. Retreat below 2600 would reinforce the signal.
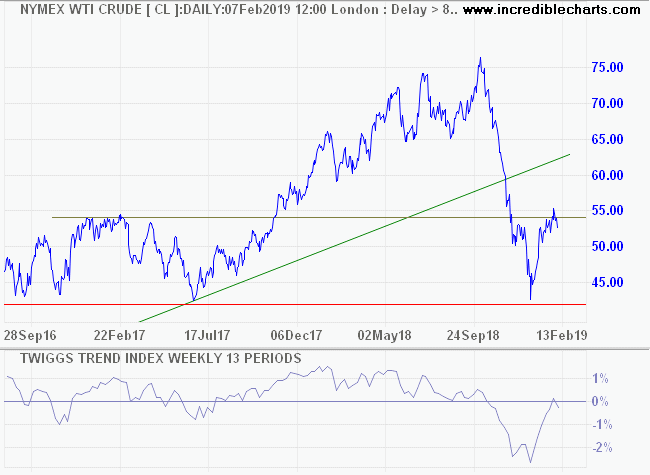
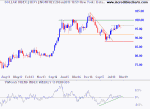
Crude prices retreated below resistance at $54/$55 per barrel, on fears of falling global (mainly Chinese) demand. Another test of primary support at $42/barrel is likely.
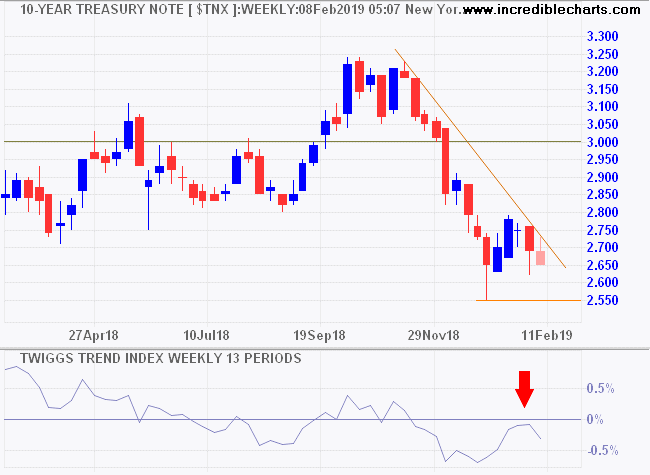
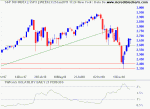
10-Year Treasury yields retreated to 2.65%. A Trend Index peak below zero warns of buying pressure from investors (yields fall when prices rise) who are looking for safety.
My conclusion is the same as last week. This is a bear market. Recovery hinges on an unlikely resolution of the US-China 'trade dispute'.
The secret of happiness is freedom and the secret of freedom is courage.
~ Thucydides (460 - 400 B.C.)
Price-Earnings versus Growth
A comment at lunch today about high price-earnings multiples got me started on one of my favorite topics: investment returns.
Most of us use the basic price-earnings ratio (PE or P/E) as a rough measure of how highly priced a stock is. The higher the P/E, the higher the risk.
But P/E only focuses on current earnings and ignores future growth which can make a huge difference to the return on your investment.
The PEG ratio, popularized by Peter Lynch in One Up On Wall Street, attempts to address this deficiency by dividing the price-earnings ratio by expected long-term growth rate of earnings.
- more than 1.0 is poor;
- less than 1.0 is good;
- less than 0.5 is excellent.
Comparing P/E to long-term growth is a step in the right direction but the PEG ratio has two notable deficiencies:
- It ignores dividends; and
- It assumes that the relationship between P/E and growth is linear.
Dividends
It is fairly obvious that two stocks trading on the same P/E, and with the same expected long-term growth rate, do not present the same value if one regularly pays dividends and the other does not. PEG can be adjusted to compensate for this deficiency, by adding the dividend yield to the expected growth rate. If we assume Computershare (ASX:CPU), for example, has a long-term growth rate of 10%, this should be adjusted to 12% to include the expected 2% dividend yield.
P/E versus Growth
The relationship is not linear. Take a look at the graph below which compares P/E ratios on the vertical axis to Growth (including dividend yield) on the horizontal axis.
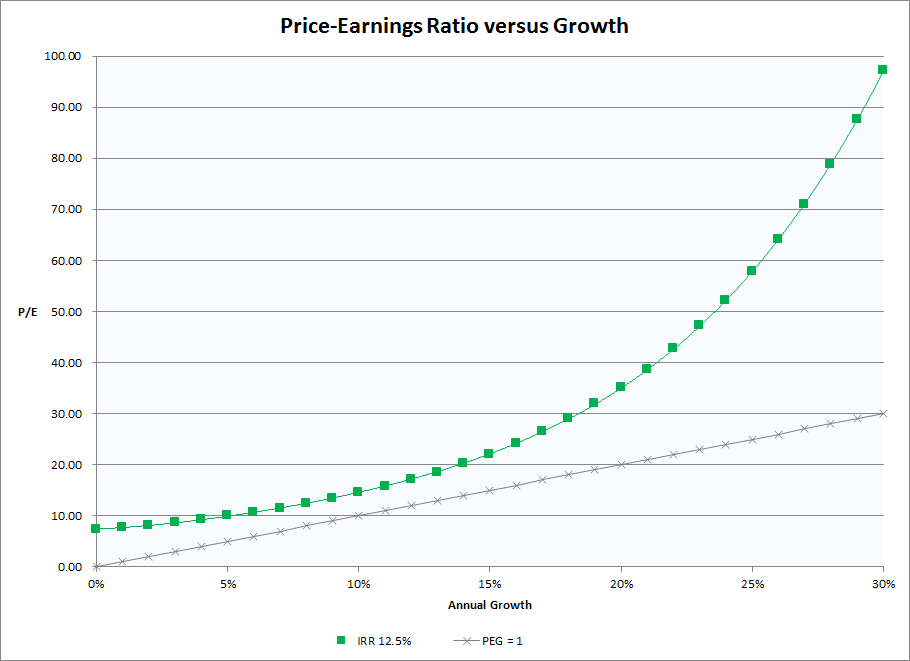
The gray line plots stock prices at a PEG ratio of 1. A P/E of 10 intersects with growth at 10%, a P/E of 20 with growth at 20%, etc.
The green line plots an internal rate of return at 12.5% p.a. on investment. Here is a brief explanation of my calculation:
I project earnings of $1 at varying growth rates for a period of 20 years. Then I discount this at 12.5% p.a. to arrive at a present value which equates to the P/E ratio (PV/$1 earnings in Year 1). I assume an exit value of zero for two reasons: (a) to simplify the model; and (b) to compensate for declining growth rates over time. I can give you ten different alternatives but this seems the most effective treatment (and I am trying to avoid this reading like a PhD thesis).
The relationship between P/E and expected growth rate is clearly exponential. If we require an annual return on investment (ROI) of 12.5% :
-
- A growth rate of 15% would justify a P/E of 22; while
- A growth rate of 30% would justify a P/E of 97.
What is clear is that price may be dictated more by high expected earnings growth than by current earnings.
How do we estimate long-term earnings growth? With difficulty.
But this is the most important factor in determining a stock's value so we need to make our best effort. Factors to consider include:
- Past revenue growth (earnings growth without corresponding revenue growth is difficult to sustain);
- Cash flow to fund future growth
- Market position
- Market growth or market saturation
- Market share
- Ability to withstand competition (rising profit margins are often a good pointer)
Conclusion: The next time you look at a PE ratio, remember that earnings growth may be more important than current earnings.
Latest
-
ASX 200
Will the spike last? -
 Gold
Gold
Gold and the Dollar direction. -
 S&P 500
Robust US employment but global bear market warning. -
Australian Economy
Quietly falling apart -
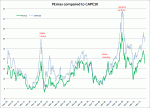
PEmax
why you should be wary of Robert Shiller's CAPE -
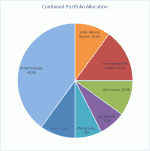
Portfolio
Investing in a volatile market - April 2018 -
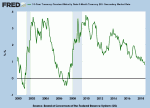
Yield Curve
Does the yield curve warn of a recession? - September 2018
Disclaimer
Colin Twiggs is director of The Patient Investor Pty Ltd, an Authorised Representative (no. 1256439) of MoneySherpa Pty Limited which holds Australian Financial Services Licence No. 451289.
Everything contained in this web site, related newsletters, training videos and training courses (collectively referred to as the "Material") has been written for the purpose of teaching analysis, trading and investment techniques. The Material neither purports to be, nor is it intended to be, advice to trade or to invest in any financial instrument, or class of financial instruments, or to use any particular methods of trading or investing.
Advice in the Material is provided for the general information of readers and viewers (collectively referred to as "Readers") and does not have regard to any particular person's investment objectives, financial situation or needs. Accordingly, no Reader should act on the basis of any information in the Material without properly considering its applicability to their financial circumstances. If not properly qualified to do this for themselves, Readers should seek professional advice.
Investing and trading involves risk of loss. Past results are not necessarily indicative of future results.
The decision to invest or trade is for the Reader alone. We expressly disclaim all and any liability to any person, with respect of anything, and of the consequences of anything, done or omitted to be done by any such person in reliance upon the whole or any part of the Material.
Please read the Financial Services Guide.