V- or M-shaped correction?
By Colin Twiggs
November 16, 2018 9:00 p.m. ET (1:00 p.m. AEST)
First, please read the Disclaimer.
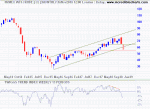
Last week I mentioned that there are few "V-shaped" corrections and plenty with a "W-shape". There are also a few with an "M-shape", leading to a major market sell-off. Here are some examples on Dow Jones Industrial Average.
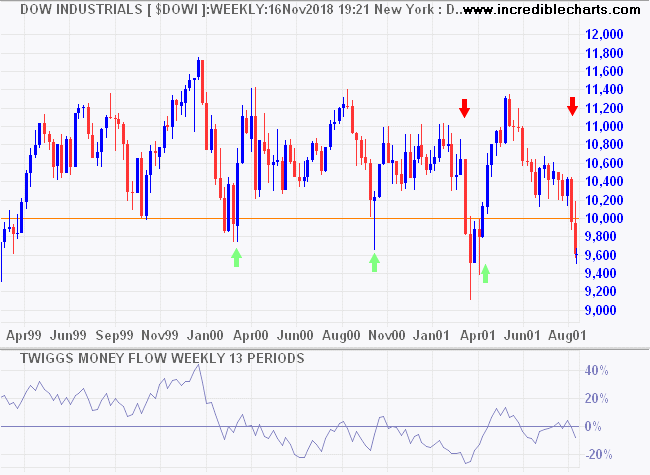
2001 is the only good example I can find of a V-shaped correction.
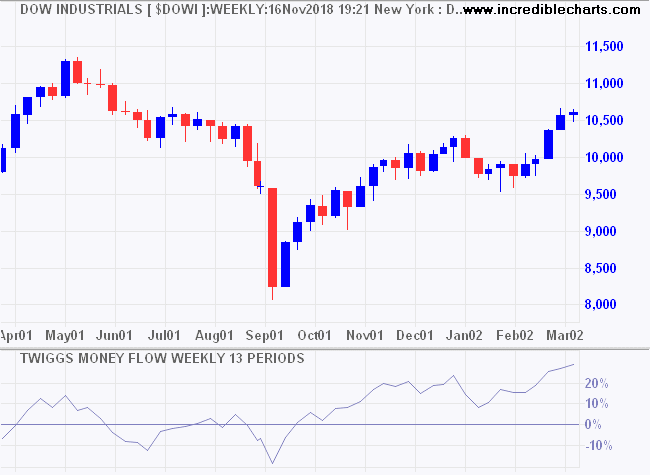
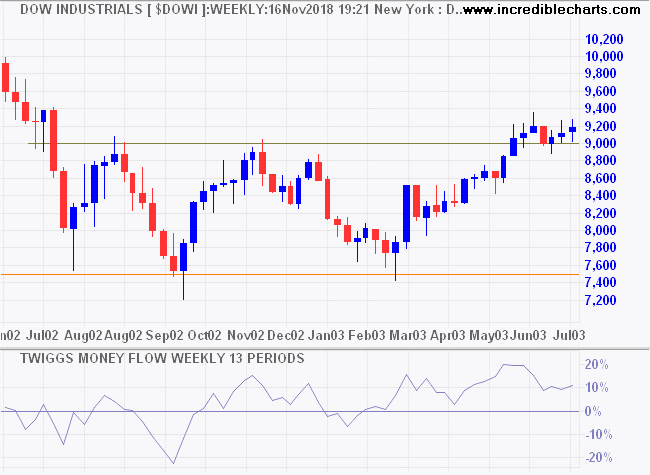
It rolled over later in 2002 into a more conventional W-shape bottom with several tests of support at 7500.
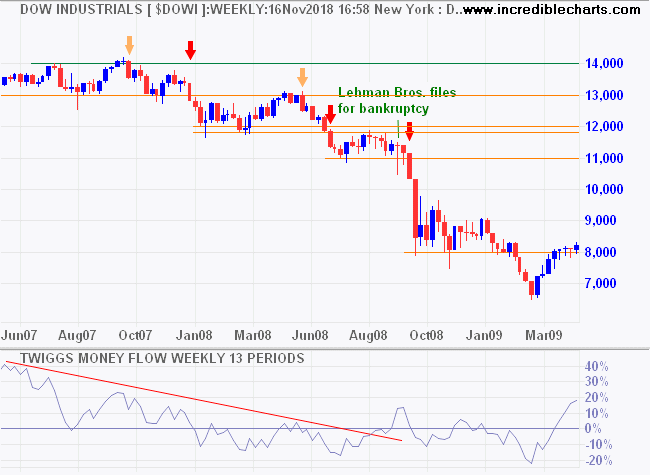
This was followed by the banking crisis of 2008 which started with an M-shape in 2007. Successive false breaks above resistance (orange arrows) were followed by breach of support (red arrow).....before Lehman Bros filing for bankruptcy on September 15 led to a major capitulation.
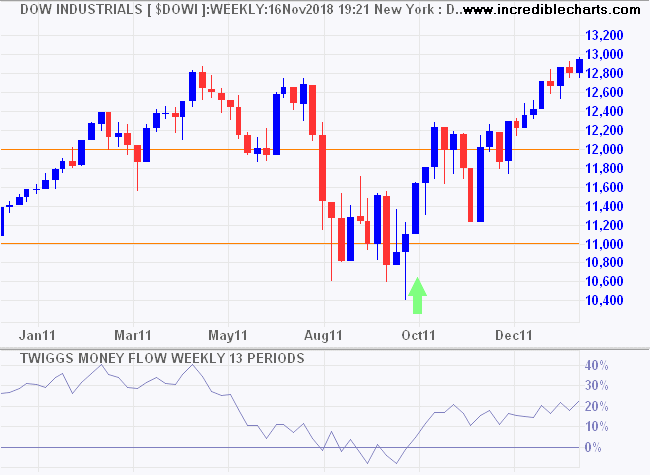
2011 is nowadays considered a secondary movement but at the time caused widespread alarm. Starting with an M-shaped top, it broke support in August before forming a W-shaped bottom with several tests of support at 11000.
2015 was a more conventional W-shape precipitated by falling oil prices.
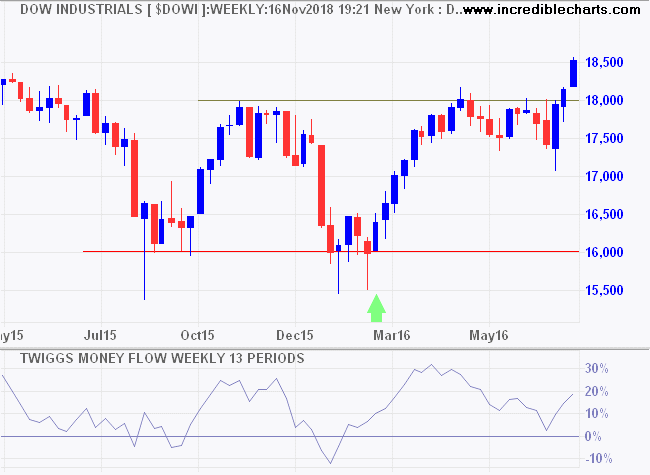
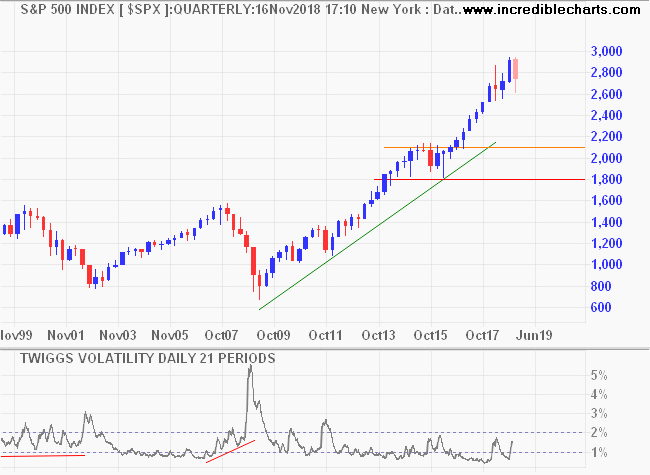
Now, in 2018, we have the makings of either a W-shaped correction or an M-shaped reversal. The false break above resistance at 26500 is definitely bearish but was followed by a bullish higher low at 24000.
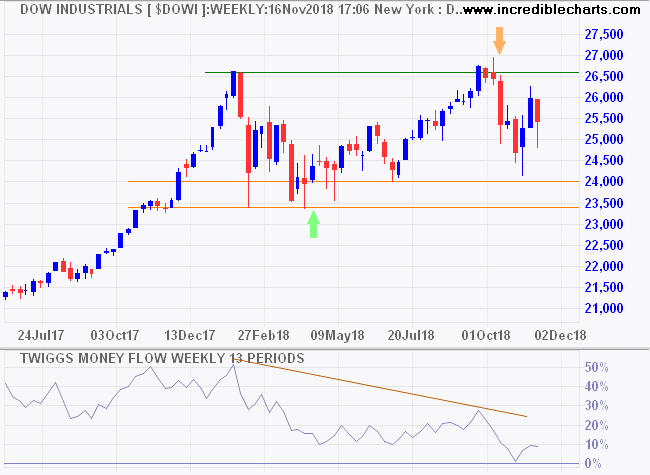
There are three possible options:
- Completion of a W-shape correction, with breakout above 27000;
- An M-shaped reversal, with a fall below 23500; or
- A lengthy consolidation reflecting uncertainty, as in 1999 to 2001.
At this stage, option 1 is most likely. Buybacks and strong Q3 earnings are likely to counter bearish sentiment.
That would change if we see:
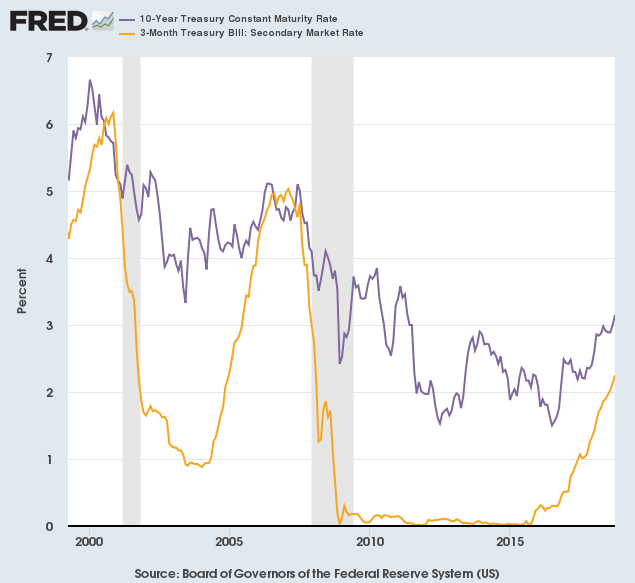
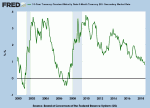
A negative yield curve, where the 3-month T-bill rate crosses above 10-year Treasury yields;
Rising troughs above 1% on the S&P 500 21-day Volatility Index; or
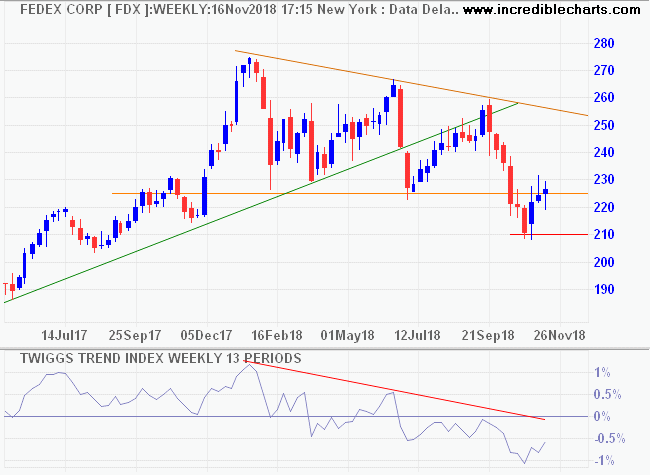
Bellwether transport stock Fedex follows-through below support at 210.
Remember that there is nothing stable in human affairs; therefore avoid undue elation in prosperity, or undue depression in adversity.
~ Socrates
Latest
-
 Stock Screens
Mark Minervini's trend Template. -
ASX 200
Banks threaten ASX 200 fall. -
Gold
Falling Crude, stronger Dollar warn of Gold weakness. -
Bonds
How will a bond bear market affect stocks? -
Yield Curve
Does the yield curve warn of a recession?
Disclaimer
Colin Twiggs is director of The Patient Investor Pty Ltd, an Authorised Representative (no. 1256439) of MoneySherpa Pty Limited which holds Australian Financial Services Licence No. 451289.
Everything contained in this web site, related newsletters, training videos and training courses (collectively referred to as the "Material") has been written for the purpose of teaching analysis, trading and investment techniques. The Material neither purports to be, nor is it intended to be, advice to trade or to invest in any financial instrument, or class of financial instruments, or to use any particular methods of trading or investing.
Advice in the Material is provided for the general information of readers and viewers (collectively referred to as "Readers") and does not have regard to any particular person's investment objectives, financial situation or needs. Accordingly, no Reader should act on the basis of any information in the Material without properly considering its applicability to their financial circumstances. If not properly qualified to do this for themselves, Readers should seek professional advice.
Investing and trading involves risk of loss. Past results are not necessarily indicative of future results.
The decision to invest or trade is for the Reader alone. We expressly disclaim all and any liability to any person, with respect of anything, and of the consequences of anything, done or omitted to be done by any such person in reliance upon the whole or any part of the Material.
Please read the Financial Services Guide.