S&P 500 earnings surge
By Colin Twiggs
August 10, 2018 9:00 p.m. EDT (11:00 a.m. AEST)
First, please read the Disclaimer.
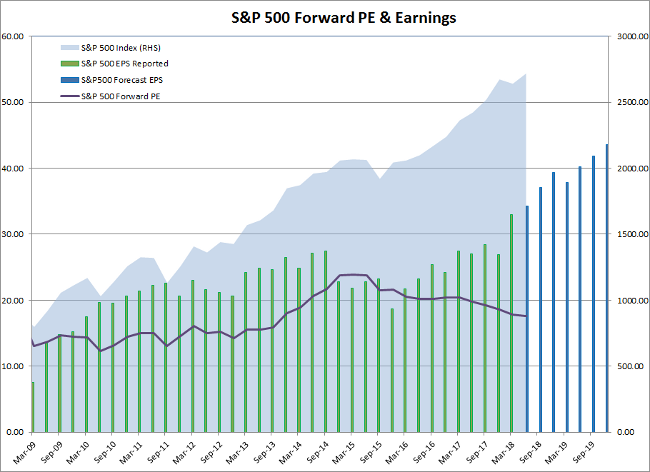
Of companies in the S&P 500 index, 90.2% have reported their results for the quarter. According to S&P Dow Jones Indices:
- Sales growth at 11.0% year-on-year (Y/Y) is close to a potential record.
- The earnings beat rate of 78% is also historically high, compared to an average of 67%.
- Operating margins are at a record 11.58%, compared to an average of 8.08% over the last 20 years.
Forward earnings estimates are climbing, driving the forward Price-Earnings ratio to a more comfortable 17.6 compared to its March 2015 high of 23.9.
Valuations based on historic earnings remain high, but P/E multiples have fallen to 22.02 from 24.16 in the last quarter. The long-term chart below compares the index price to previous highest annual EPS, to eliminate distortions caused by sudden falls in earnings.
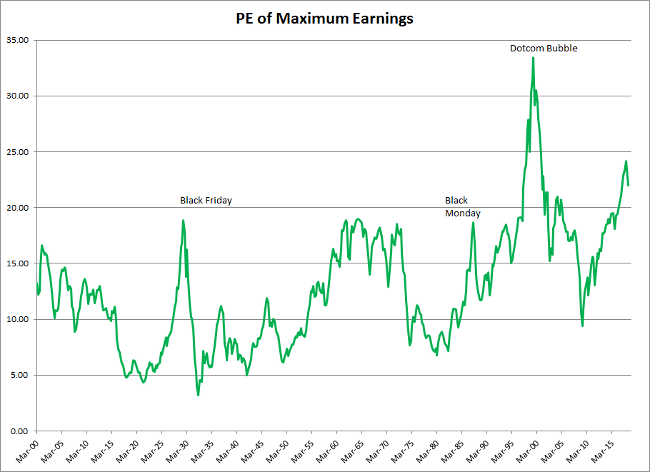
The current earnings multiple is still significantly higher than the 18.86 reached prior to the 1929 Wall Street crash and 18.69 in October 1987. But high valuations don't cause market crashes. Sudden falls in earnings do. And there is little sign of that at present.
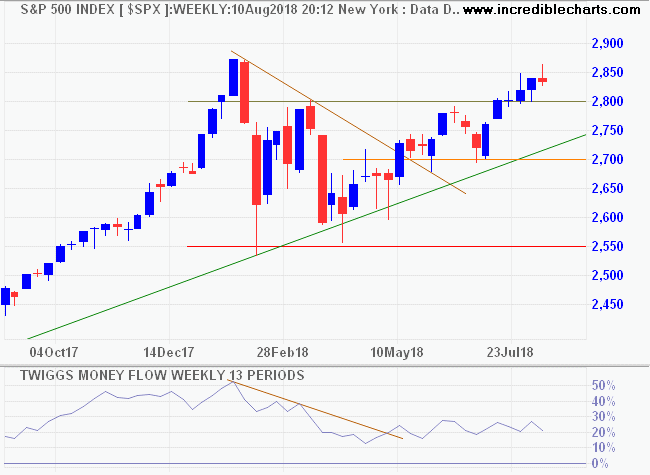
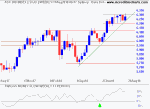
The S&P 500 is retracing for another test of its new support level at 2800. Respect would signal an advance to 3000. Declining Money Flow warns of selling pressure but this appears secondary in nature, with the indicator still well above the zero line.
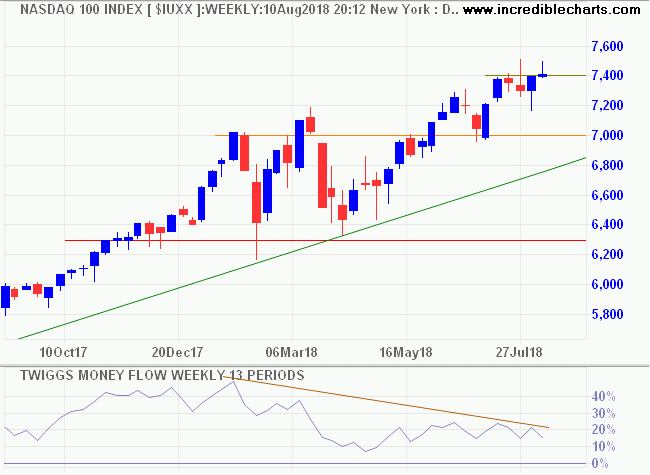
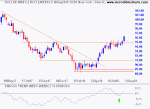
The Nasdaq 100 also warns of a correction, with bearish divergence on Twiggs Money Flow. Again this appears secondary in nature because of the indicator's position relative to the zero line. Expect a test of support at 7000.
Sometimes the questions are complicated and the answers are simple.
~ Dr Seuss
Latest
-
ASX 200
Buying pressure. -
Gold
No silver lining for gold stocks. -
Research Update
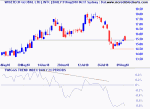
Wisetech Global Ltd (WTC) -
Model Portfolios
Australian & International model portfolios based on my investment strategy.
Disclaimer
Colin Twiggs is director of The Patient Investor Pty Ltd, an Authorised Representative (no. 1256439) of MoneySherpa Pty Limited which holds Australian Financial Services Licence No. 451289.
Everything contained in this web site, related newsletters, training videos and training courses (collectively referred to as the "Material") has been written for the purpose of teaching analysis, trading and investment techniques. The Material neither purports to be, nor is it intended to be, advice to trade or to invest in any financial instrument, or class of financial instruments, or to use any particular methods of trading or investing.
Advice in the Material is provided for the general information of readers and viewers (collectively referred to as "Readers") and does not have regard to any particular person's investment objectives, financial situation or needs. Accordingly, no Reader should act on the basis of any information in the Material without properly considering its applicability to their financial circumstances. If not properly qualified to do this for themselves, Readers should seek professional advice.
Investing and trading involves risk of loss. Past results are not necessarily indicative of future results.
The decision to invest or trade is for the Reader alone. We expressly disclaim all and any liability to any person, with respect of anything, and of the consequences of anything, done or omitted to be done by any such person in reliance upon the whole or any part of the Material.
Please read the Financial Services Guide.