CAPE v PEMAX: How hot are market valuations?
By Colin Twiggs
December 08, 2017 11:30 p.m. EDT (3:30 p.m. AEST)
Please note changes to the Disclaimer.
Robert Shiller's CAPE ratio is currently at 32.17, the second-highest peak in recorded history. According to multpl.com, prior to the Black Tuesday crash of 1929 CAPE had a reading of 30. The only peak with a higher reading is the Dotcom bubble at 44.
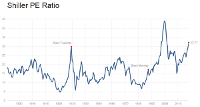
Click here to view at multpl.com.
Shiller's CAPE, or Cyclically Adjusted PE Ratio to give it its full name, compares the current S&P 500 index value to the 10-year average of inflation-adjusted earnings. The aim is to smooth out the earnings cycle and provide a stable assessment of long-term potential earnings.
But earnings have fluctuated wildly in the past 10 years, and a 10-year average which includes severe losses from 2009 may not be an accurate reflection of current earnings potential.
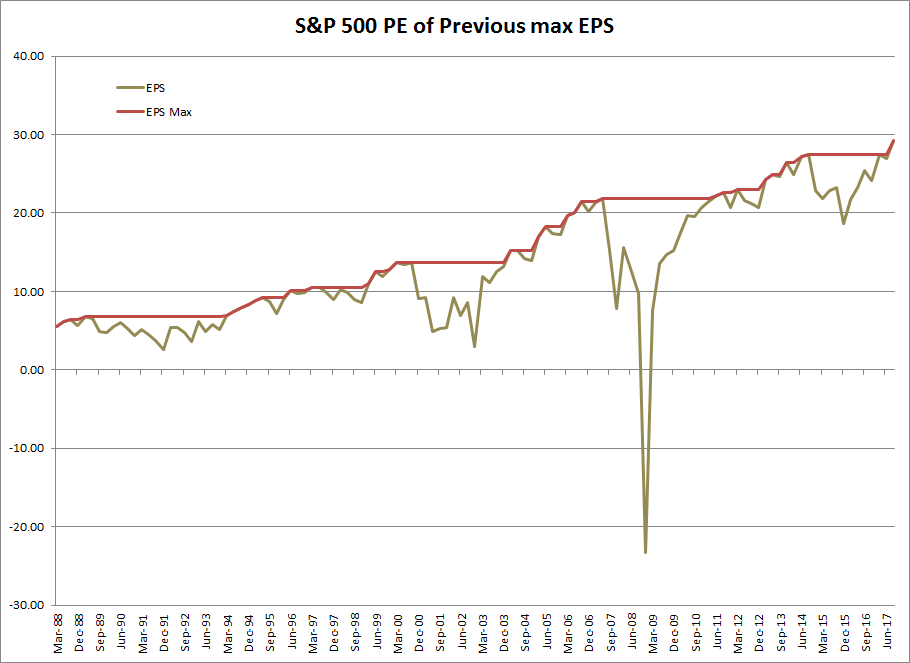
The dark line plotted on the above chart reflects the highest earnings to-date, or maximum EPS. The market often references this as the current, long-term earnings potential, in place of cyclical earnings.
The chart below compares maximum EPS (the highest earnings to-date) to the S&P 500 index. The horizontal periods on max EPS reflect when cyclical earnings are falling.
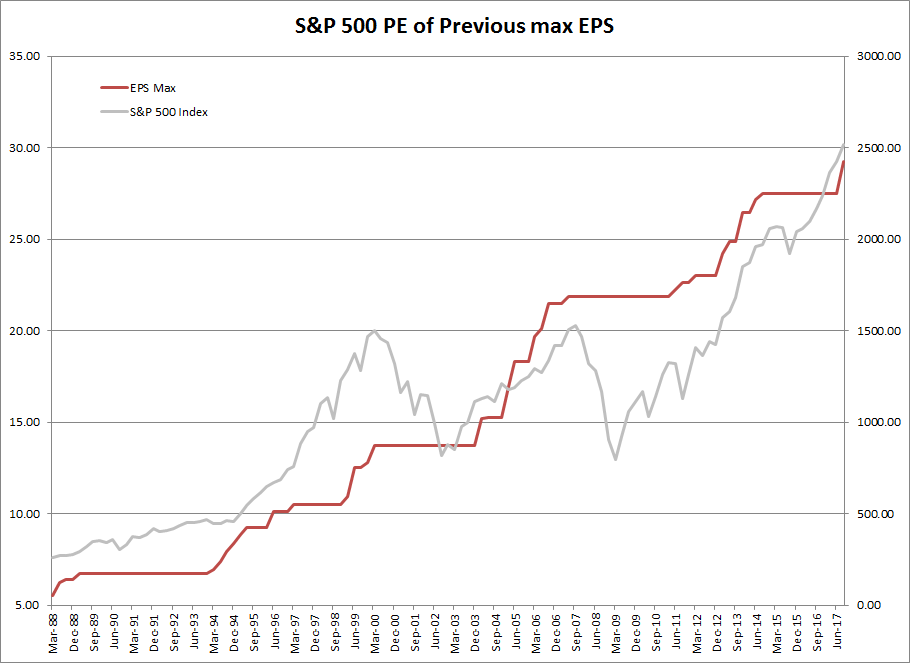
It is clear that the index falls in response to cyclical fluctuations in earnings (the flat periods on EPS max). But it is also clear that earnings quickly recover to new highs after the index has bottomed. In Q1 of 2004 after the Dotcom crash and in Q3 of 2011 after the 2008 global financial crisis.
The next chart plots the current index price divided by maximum earnings to-date. I call it PEMAX. When earnings are making new highs, as at present, PEMAX will reflect the same ratio as for trailing 12-month PE. When earnings are below the previous high, PEMAX is lower than the trailing PE.
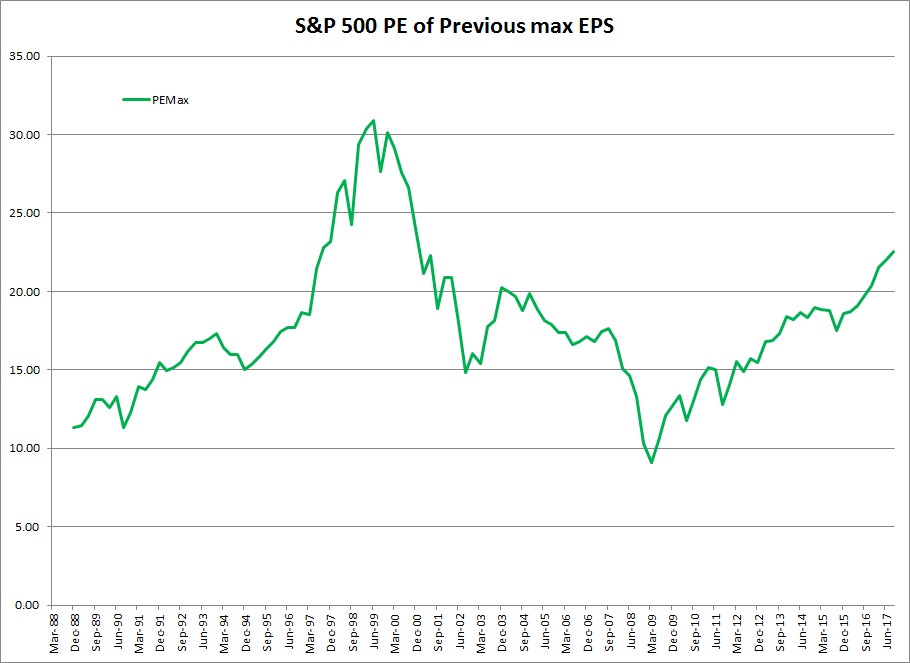
What the chart shows is that, outside of the Dotcom bubble, prices are highest in the last 30 years relative to current earnings potential. The current value of 22.56 is higher than at any time other than the surge leading into the Dotcom crash.
The peak value during the Dotcom bubble was 30.19 in Q2 of 1999. The highest value in the lead-up to the GFC was 20.23 in Q4 of 2003.
Does the current value of 22.56 mean that the market is about to crash?
No. The Dotcom bubble went on for two more years after reaching 22.80 in Q3 of 1997. The present run may continue for a while longer.
But it does serve as a reminder to investors that they are paying top-dollar for stocks. And at some point values are going to fall to the point that sanity is restored.
The four most expensive words in the English language are "this time it's different."
~ Sir John Templeton
Disclaimer
Colin Twiggs is director of The Patient Investor Pty Ltd, an Authorised Representative (no. 1256439) of MoneySherpa Pty Limited which holds Australian Financial Services Licence No. 451289.
Everything contained in this web site, related newsletters, training videos and training courses (collectively referred to as the "Material") has been written for the purpose of teaching analysis, trading and investment techniques. The Material neither purports to be, nor is it intended to be, advice to trade or to invest in any financial instrument, or class of financial instruments, or to use any particular methods of trading or investing.
Advice in the Material is provided for the general information of readers and viewers (collectively referred to as "Readers") and does not have regard to any particular person's investment objectives, financial situation or needs. Accordingly, no Reader should act on the basis of any information in the Material without properly considering its applicability to their financial circumstances. If not properly qualified to do this for themselves, Readers should seek professional advice.
Investing and trading involves risk of loss. Past results are not necessarily indicative of future results.
The decision to invest or trade is for the Reader alone. We expressly disclaim all and any liability to any person, with respect of anything, and of the consequences of anything, done or omitted to be done by any such person in reliance upon the whole or any part of the Material.
More....