More Selling Pressure
By Colin Twiggs
October 14, 2016 9:00 p.m. EDT (12:00 midday AEST)
Disclaimer
I am not a licensed investment adviser.
Everything contained in this web site, related newsletters, training videos and training courses (collectively referred to as the "Material") has been written for the purpose of teaching analysis, trading and investment techniques. The Material neither purports to be, nor is it intended to be, advice to trade or to invest in any financial instrument, or class of financial instruments, or to use any particular methods of trading or investing.
Advice in the Material is provided for the general information of readers, viewers and course attendees (collectively referred to as "Readers") and does not have regard to any particular person's investment objectives, financial situation or needs. Accordingly, no Reader should act on the basis of any information in the Material without properly considering its applicability to their financial circumstances. If not properly qualified to do this for themselves, Readers should seek professional advice.
Investing and trading involves risk of loss. Past results are not necessarily indicative of future results.
The decision to invest or trade is for the Reader alone. I expressly disclaim all and any liability to any person, with respect of anything, and of the consequences of anything, done or omitted to be done by any such person in reliance upon the whole or any part of the Material.
Global
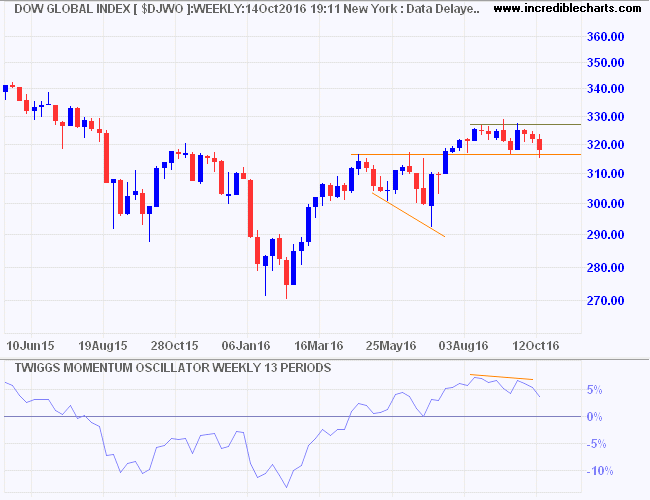
Dow Jones Global Index has formed a rounded top and is testing support at 316. Recovery above 328 would signal another strong advance but breach of 316 is more likely and could test support at 300.
North America
Bearish divergence on Twiggs Money Flow continues to warn of long-term selling pressure on the Dow Jones Industrial Average. Breach of 18000 would warn of a test of primary support at 17000.
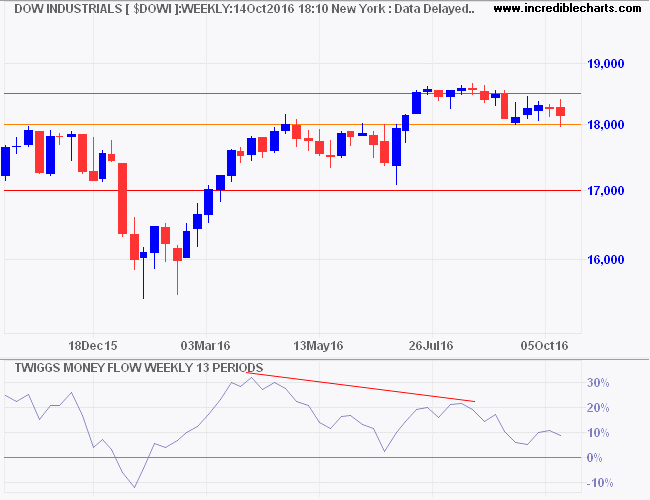
* Target medium-term: 18500 + ( 18500 - 18000 ) = 19000
Superficially, the economy looks in good shape, with falling unemployment and the Leading Index at a healthy 1.40 (down-turn below 1.0 would warn of trouble ahead).
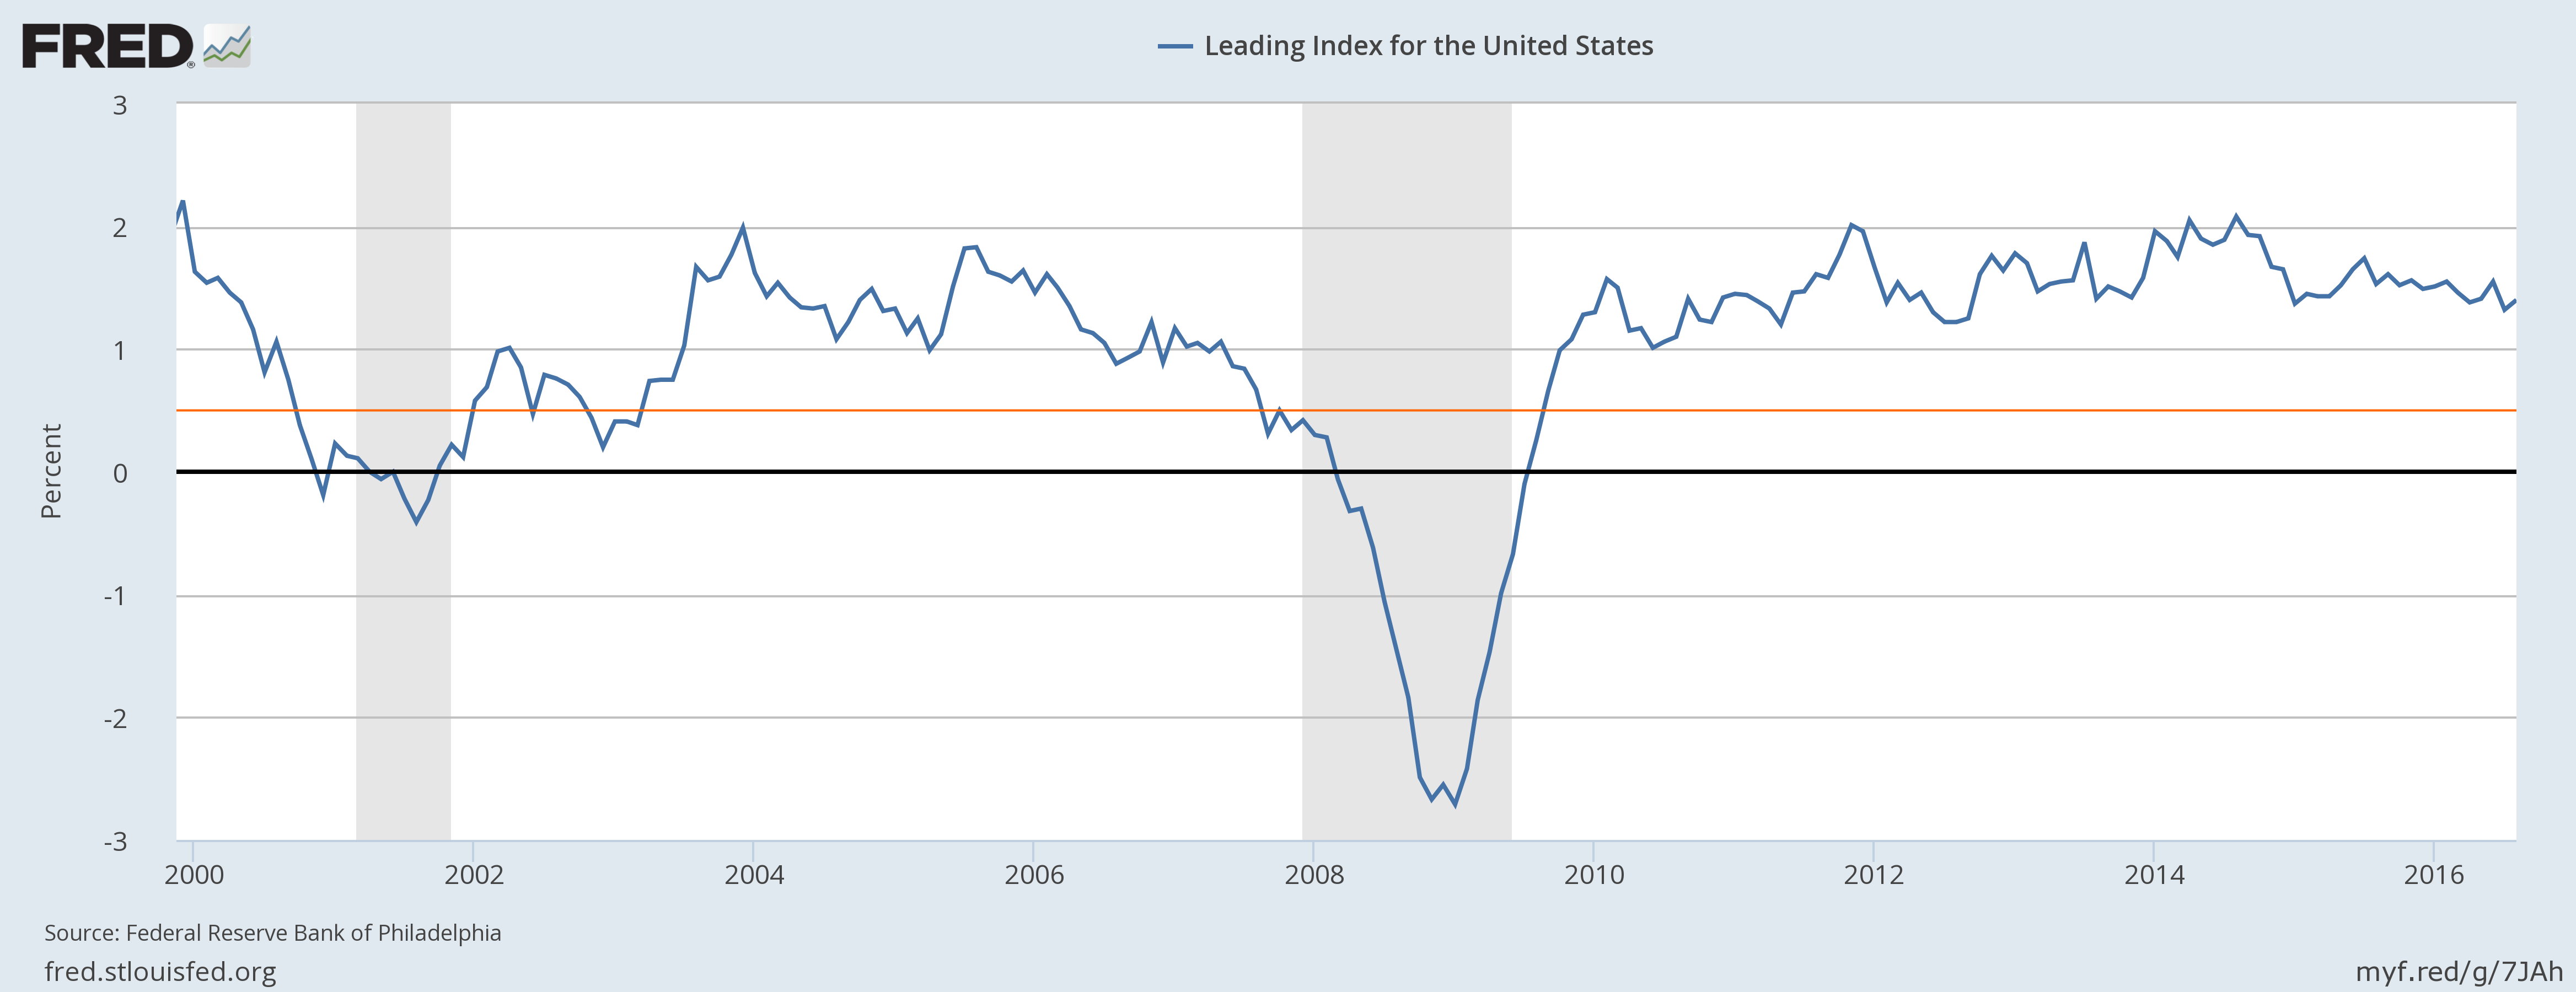
The Leading Index from the Philadelphia Fed predicts the six-month growth rate of the Coincident Index. In addition to the coincident index, the model includes other variables that lead the economy: housing permits (1 to 4 units), initial unemployment insurance claims, delivery times from the Institute for Supply Management (ISM) manufacturing survey, and the interest rate spread between the 10-year Treasury bond and the 3-month Treasury bill.
The St Loouis Financial Stress Index indicates low stress levels, as one would expect from a financial market awash with easy money.
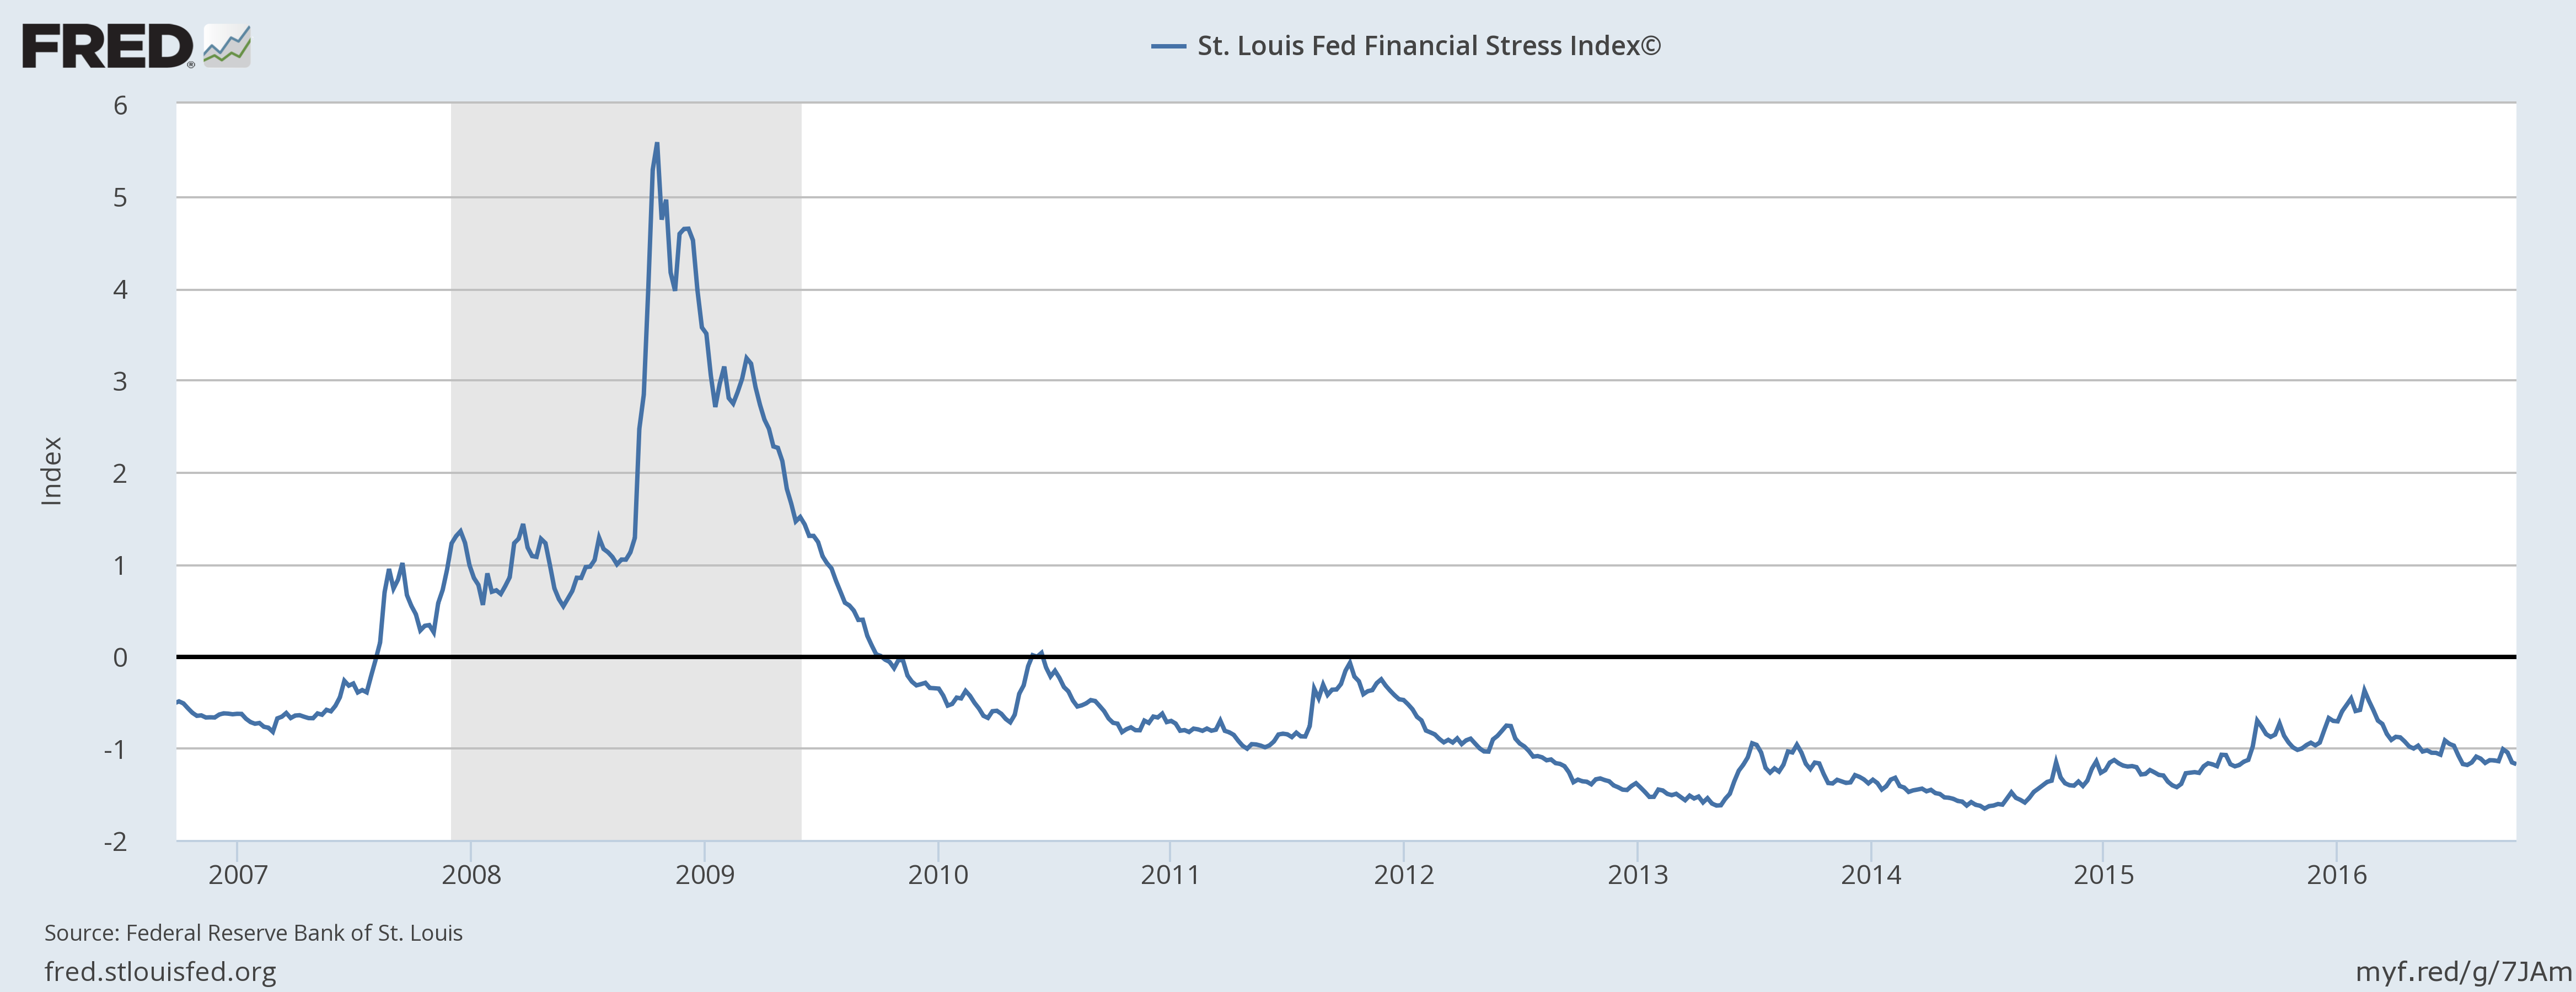
The Financial Stress Index from St Louis Fed measures the degree of financial stress in the markets and is constructed from 18 weekly data series: seven interest rate series, six yield spreads and five other indicators. Each of these variables captures some aspect of financial stress. Accordingly, as the level of financial stress in the economy changes, the data series are likely to move together.
The average value of the index, which begins in late 1993, is designed to be zero. Thus, zero is viewed as representing normal financial market conditions. Values below zero suggest below-average financial market stress, while values above zero suggest above-average financial market stress.
But there are cracks in the foundations that need to be fixed. Growth is faltering as private investment declines (as a percentage of GDP). And financial markets grow increasingly brittle if debt grows at a faster rate than investment.
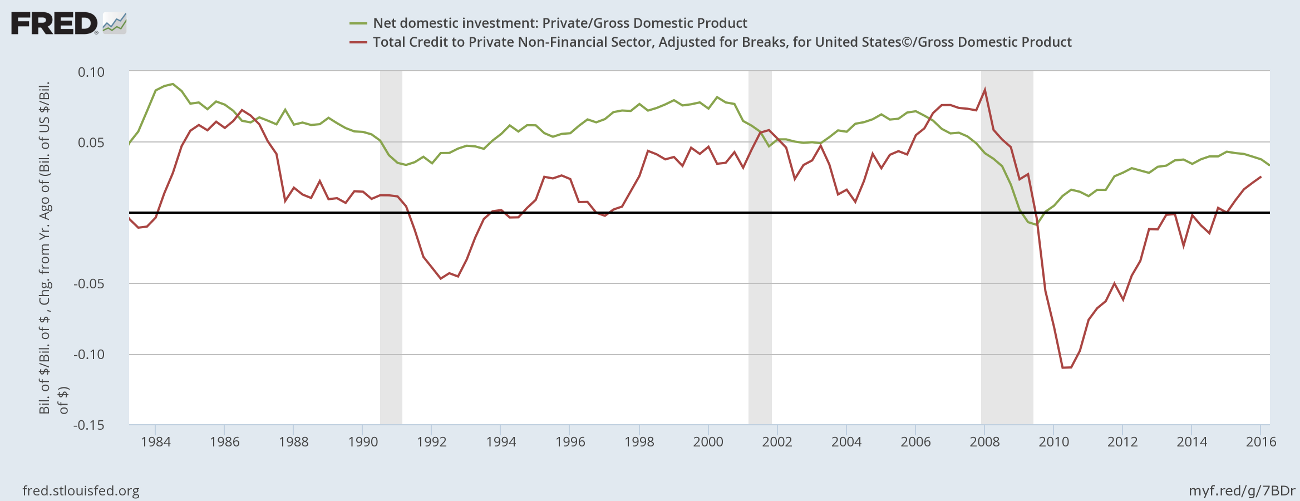
In fact, debt should remain constant against GDP, with zero on the above graph as the ceiling.
Australia
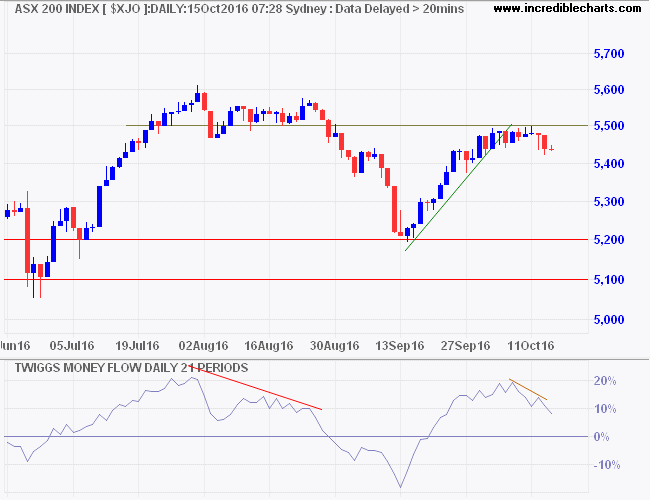
The latest ASX 200 has run into resistance at 5500. Declining Twiggs Money Flow warns of selling pressure. Breakout below 5400 would warn of another test of primary support. And breach of 5200 would signal a primary down-trend.
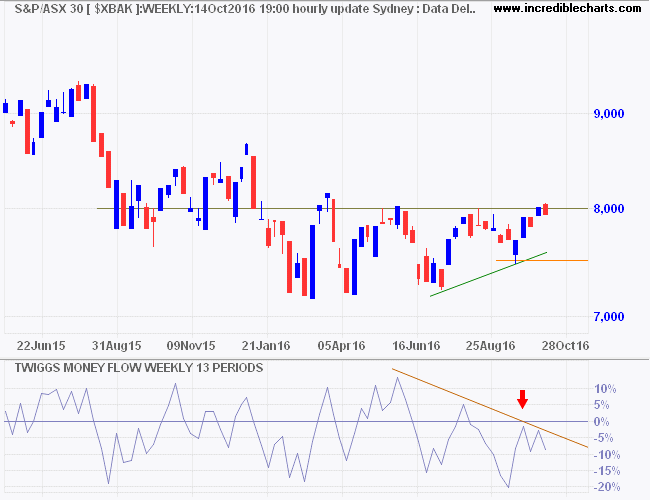
The ASX 300 Banks Index retreated after a false break above 8000, as expected. Declining Twiggs Money Flow warns of strong selling pressure. Breach of support at 7500 would warn of another decline.
Science is organized knowledge. Wisdom is organized life.
~ Will Durant, The Story of Philosophy
