No fish on the hook
By Colin Twiggs
September 8, 2016 8:00 p.m. EDT (10:00 a.m. AEST)
Disclaimer
I am not a licensed investment adviser.
Everything contained in this web site, related newsletters, training videos and training courses (collectively referred to as the "Material") has been written for the purpose of teaching analysis, trading and investment techniques. The Material neither purports to be, nor is it intended to be, advice to trade or to invest in any financial instrument, or class of financial instruments, or to use any particular methods of trading or investing.
Advice in the Material is provided for the general information of readers, viewers and course attendees (collectively referred to as "Readers") and does not have regard to any particular person's investment objectives, financial situation or needs. Accordingly, no Reader should act on the basis of any information in the Material without properly considering its applicability to their financial circumstances. If not properly qualified to do this for themselves, Readers should seek professional advice.
Investing and trading involves risk of loss. Past results are not necessarily indicative of future results.
The decision to invest or trade is for the Reader alone. I expressly disclaim all and any liability to any person, with respect of anything, and of the consequences of anything, done or omitted to be done by any such person in reliance upon the whole or any part of the Material.
Global
Dow Jones Global Index respected the new support level at 316/320, confirming another advance. Momentum troughs above zero flag trend strength. The target is 340*.
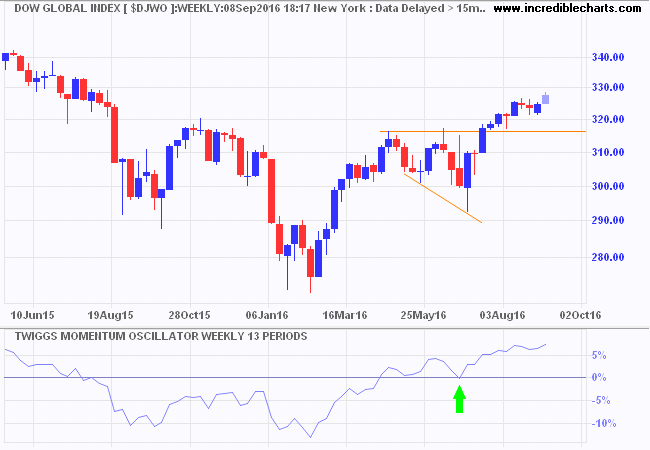
* Target calculation: 316 + ( 316 - 292 ) = 340
North America
At present we have an incomplete fish hook and no bites.
The S&P 500 continues to consolidate below 2200 with a rounding top. A short downward leg would complete an inverted scallop — like an inverted fishing hook — a strong continuation pattern in bull markets. Respect of support at 2100/2130 would complete the pattern. Twiggs Money Flow strong values continue to indicate buying pressure. All we need is patience.
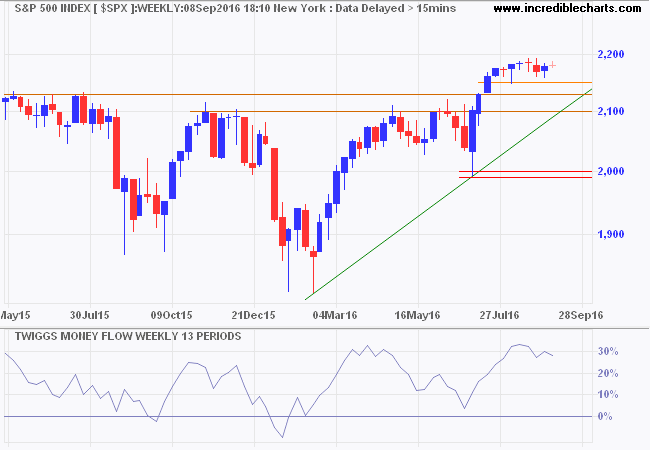
* Target calculation: 2100 + ( 2100 - 1800 ) = 2400
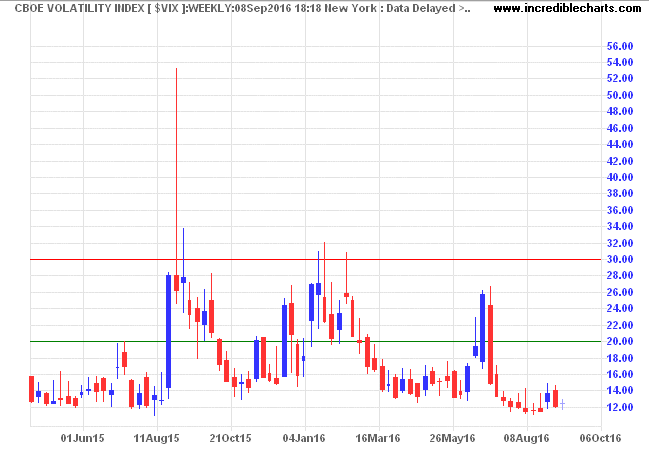
VIX remains below 20, indicating low market risk.
Europe
Germany's DAX respected support at 10500, confirming the primary up-trend. The latest Twiggs Money Flow trough high above zero indicates strong buying pressure.
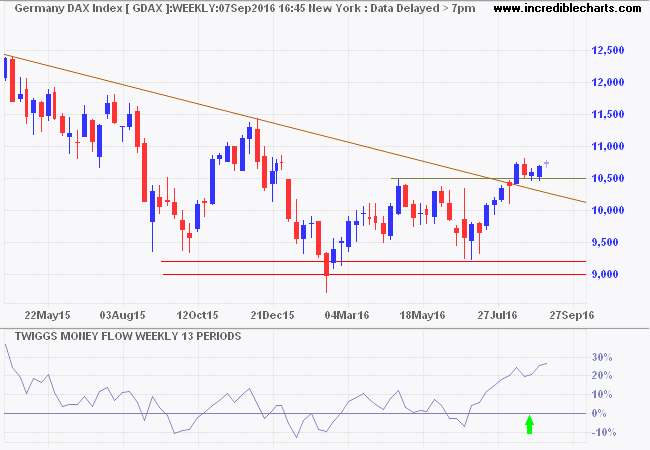
* Target calculation: 10500 + ( 10500 - 9500 ) = 11500
The Footsie retracement found support at 6750. Rising Momentum indicates a healthy up-trend. Expect stubborn resistance at 7000/7100*.
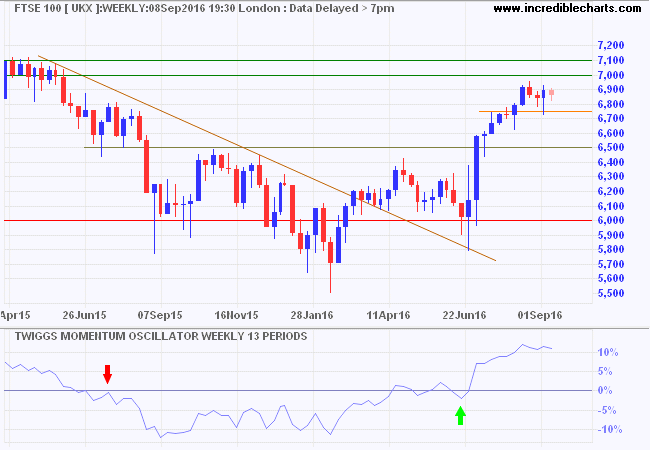
* Target calculation: 6500 + ( 6500 - 5900 ) = 7100
Australia
The ASX 200 is testing the lower trend channel. Bearish divergence on Twiggs Money Flow warns of strong selling pressure. Breach of the lower trend channel would test primary support at 5000. Respect of 5400 is unlikely but would suggest another swing to the upper trend channel.
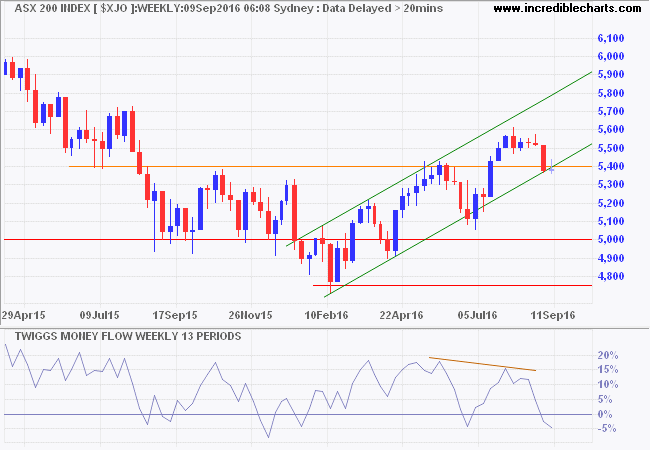
* Target calculation: 5400 + ( 5400 - 5100 ) = 5700
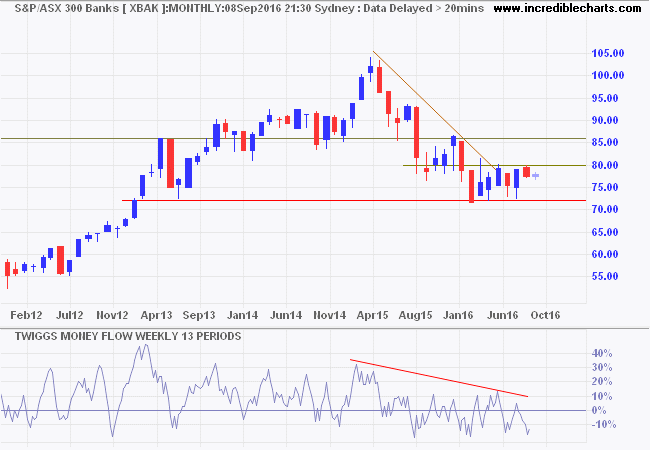
The ASX 300 Banks Index is consolidating between 7200 and 8000. Penetration of the descending trendline on the monthly chart suggests that a bottom is forming but declining Twiggs Money Flow peaks warn of strong selling pressure. Downward breakout is more likely.
Homo sapiens

