Gold tests $1200; Don't fight the Fed
By Colin Twiggs
May 31rd, 2016 4:00 a.m. EDT (6:00 p.m. AEST)
Advice herein is provided for the general information of readers and does not have regard to any particular person's investment objectives, financial situation or needs. Accordingly, no reader should act on the basis of any information contained herein without first having consulted a suitably qualified financial advisor.
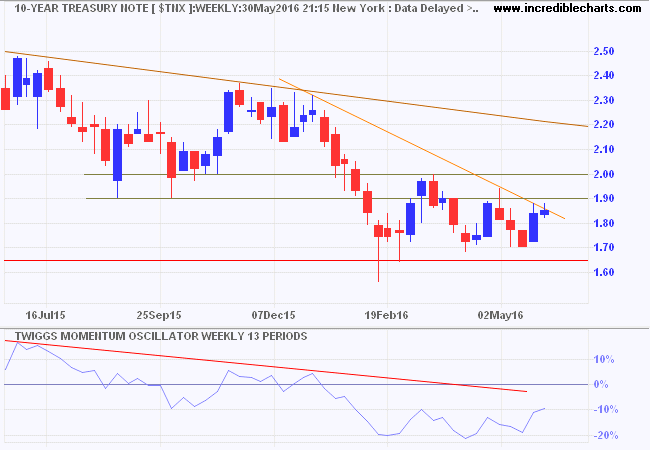
The Fed talking up a rate rise in June/July has boosted long-term interest rates, with 10-year Treasury yields rallying off support at 1.65%/1.70% to test resistance at 1.90%/2.00%.
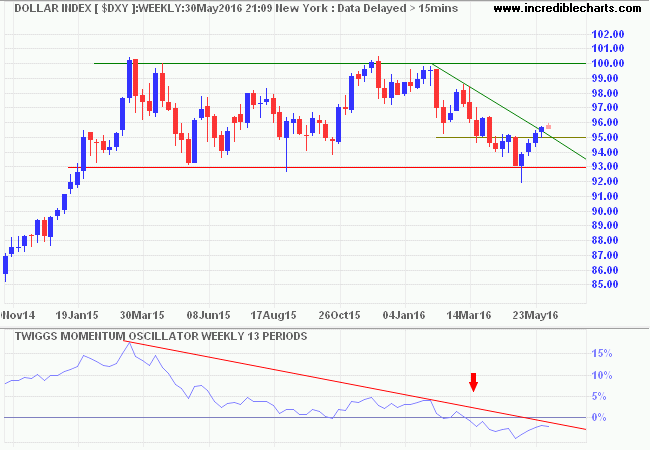
And boosted the Dollar, with the Dollar Index breaking resistance at 95. Penetration of the descending trendline suggests that a bottom is forming.
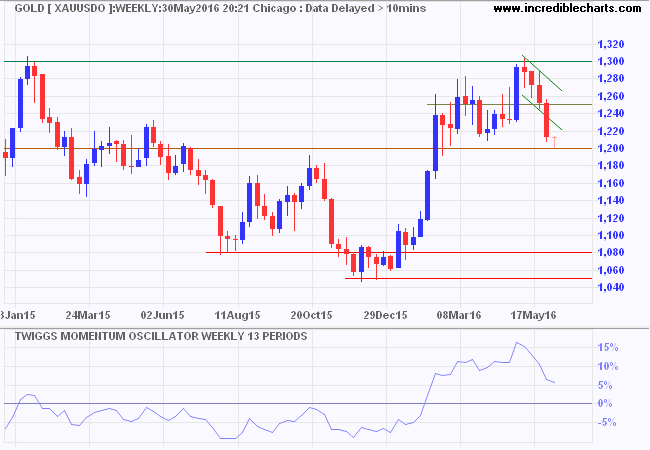
The rising Dollar has taken the wind out of the sails for gold, with the spot price testing the band of support at $1180 to $1200. A fall below $1180 would indicate the up-trend is weakening, as would reversal of 13-week Momentum below zero. But respect remains more likely.
The Dollar also strengthened against the Chinese Yuan, testing resistance at 6.60.
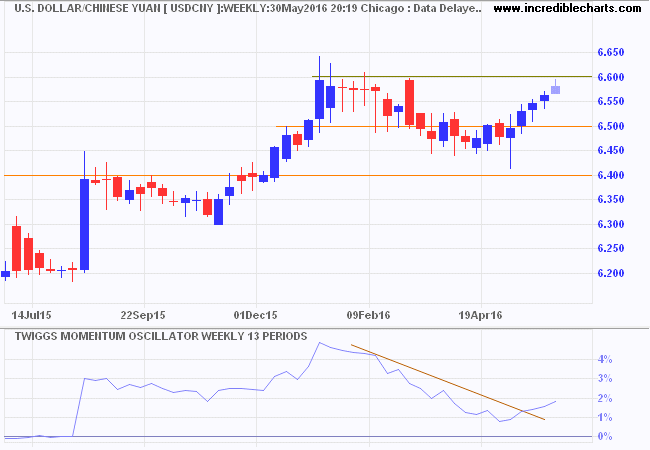
This creates a dilemna for the People's Bank of China (PBOC): either allow the Yuan to weaken, which could spark a major capital flight, or further deplete its foreign reserves to support the Yuan.
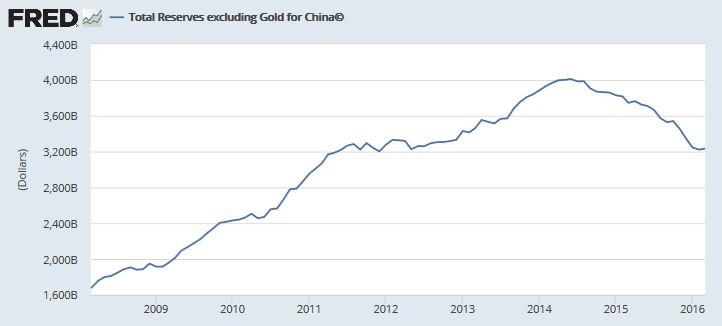
Further sell-off of foreign reserves is likely .....and would weaken the Dollar, driving up the gold price. The alternative, allowing the Yuan to weaken, would also boost demand for gold as Chinese investors look for a safe haven. Prevented from buying Dollars by increased capital controls, gold and other commodities such as copper present the best store of value.
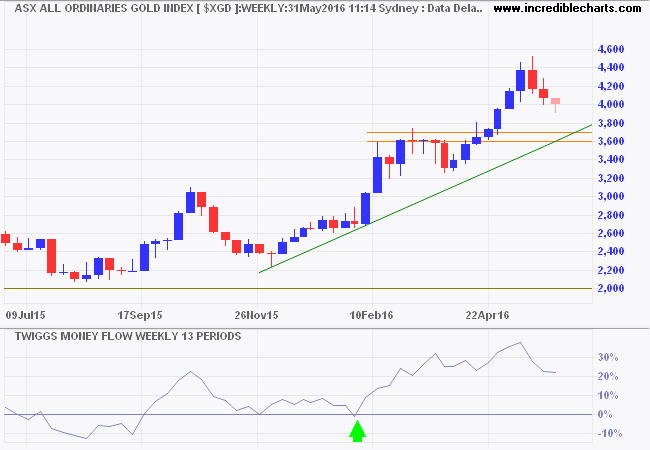
The All Ords Gold Index ($XGD) seems to be taking recent fluctuations in its stride. Money Flow indicates strong buying pressure. Respect of support at 3600 to 3700 would confirm the primary up-trend.
Don't fight the Fed....
A prolonged period of easy money from the Fed helped stave off a major bear market earlier this year.....
The St Louis Fed Financial Stress Index retreated to -1 standard deviation, indicating financial stress in the economy has eased.
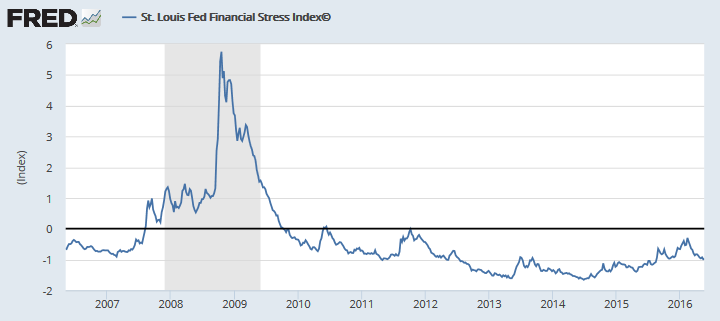
St. Louis Fed Financial Stress Index©
The STLFSI measures the degree of financial stress in the markets and is constructed from 18 weekly data series: seven interest rate series, six yield spreads and five other indicators. Each of these variables captures some aspect of financial stress. Accordingly, as the level of financial stress in the economy changes, the data series are likely to move together.
How to Interpret the Index
The average value of the index, which begins in late 1993, is designed to be zero. Thus, zero is viewed as representing normal financial market conditions. Values below zero suggest below-average financial market stress, while values above zero suggest above-average financial market stress.
Combined with a major stimulus program in China, the Fed soft-pedalling on interest rates saved emerging markets and the global economy from a serious contraction earlier this year.
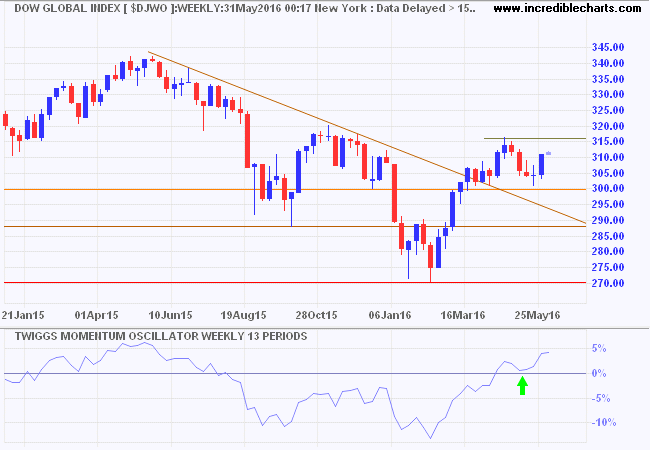
Dow Jones Global Index recovered on the back of a weaker Dollar and stronger commodity prices. Breakout above 316 would complete an inverted head and shoulders formation, signaling a primary up-trend. A Twiggs Momentum trough above zero also suggests a primary up-trend.
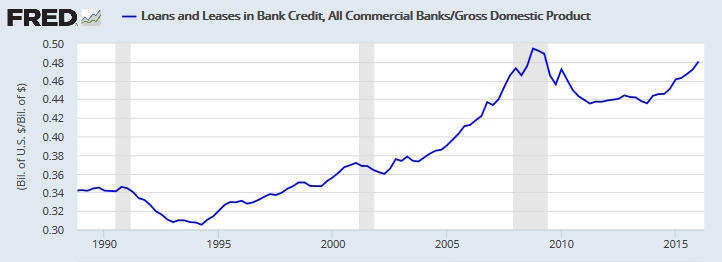
US bank credit growing at a faster pace than nominal GDP normally indicates a healthy recovery.
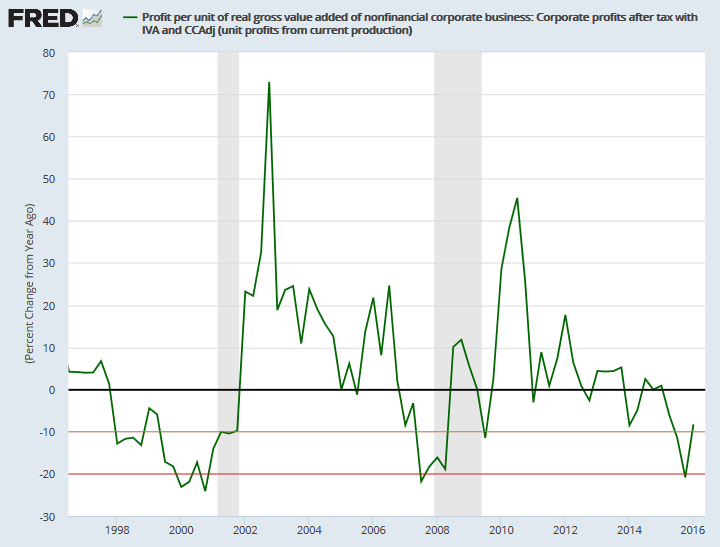
Profit margins continue to fall, but the rate of decline slowed in Q1 2016 to less than 10 percent, an indication that the worst is over.
.... but there are some negative side-effects. The prolonged period of easy money encouraged corporations to embark on a massive program of stock buy-backs — $572 billion for the S&P 500 in 2015 alone — helped to support stock prices while funds were net sellers.
Past recoveries have shown a healthy margin between net capital formation and debt increases for nonfinancial corporations as fresh equity and retained earnings were plowed into new capital investment. This time, debt has increased in step with new capital formation. Corporations are borrowing at a record rate (prices are adjusted to 2009 Dollars) which exceeds the pace of net capital formation. Dividends and buybacks exceed earnings.
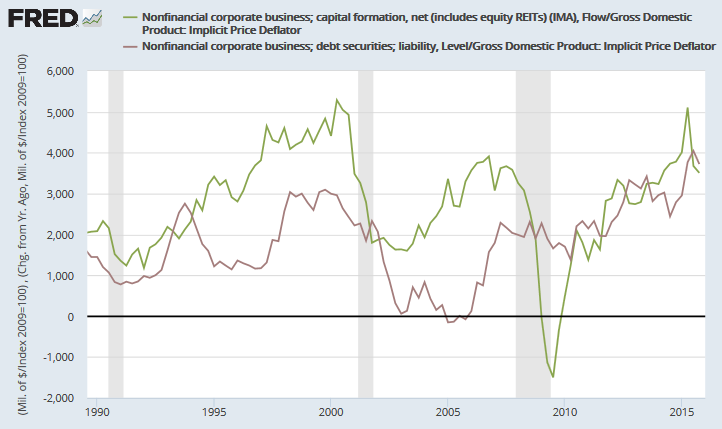
While the cost of borrowing is cheap at present, the cost of rolling over debt somewhere down the track may not be. By which time many current senior executives will be enjoying a richly-rewarded retirement.
Net Capital Formation
Net Capital Formation measures growth in the (physical) capital stock of an economy. It comprises new additions minus disposals and a provision for depreciation to compensate for loss in value of existing assets through normal usage, wear and tear, and obsolescence.
Democracy must be something more than two wolves and a sheep voting on what to have for dinner.
~ James Bovard: Lost Rights, The Destruction of American Liberty
Disclaimer
Porter Private Clients Pty Ltd, trading as Research & Investment ("R&I"), is a Corporate Authorized Representative (AR Number 384 397) of Andika Pty Ltd which holds an Australian Financial Services Licence (AFSL 297069).
The information on this web site and in the newsletters is general in nature and does not consider your personal circumstances. Please contact your professional financial adviser for advice tailored to your needs.
R&I has made every effort to ensure the reliability of the views and recommendations expressed in the reports published on its websites and newsletters. Our research is based upon information known to us or which was obtained from sources which we believe to be reliable and accurate.
No guarantee as to the capital value of investments, nor future returns are made by R&I. Neither R&I nor its employees make any representation, warranty or guarantee that the information provided is complete, accurate, current or reliable.
You are under no obligation to use these services and should always compare financial services/products to find one which best meets your personal objectives, financial situation or needs.
To the extent permitted by law, R&I and its employees, agents and authorised representatives exclude all liability for any loss or damage (including indirect, special or consequential loss or damage) arising from the use of, or reliance on, any information. If the law prohibits the exclusion of such liability, such liability shall be limited, to the extent permitted by law, to the resupply of the said information or the cost of the said resupply.
Important Warning About Simulated Results
Research & Investment (R&I) specialise in developing, testing and researching investment strategies and systems. Within the R&I web site and newsletters, you will find information about investment strategies and their performance. It is important that you understand that results from R&I research are simulated and not actual results.
No representation is made that any investor will or is likely to achieve profits or losses similar to those shown.
Simulated performance results are generally prepared with the benefit of hindsight and do not involve financial risk. No modeling can completely account for the impact of financial risk in actual investment. Account size, brokerage and slippage may also diverge from simulated results. Numerous other factors related to the markets in general or to the implementation of any specific investment system cannot be fully accounted for in the preparation of simulated performance results and may adversely affect actual investment results.
To the extent permitted by law, R&I and its employees, agents and authorised representatives exclude all liability for any loss or damage (including indirect, special or consequential loss or damage) arising from the use of, or reliance on, any information offered by R&I whether or not caused by any negligent act or omission.
