Gold, China's Yuan and the Dollar
Advice herein is provided for the general information of readers and does not have regard to any particular person's investment objectives, financial situation or needs. Accordingly, no reader should act on the basis of any information contained herein without first having consulted a suitably qualified financial advisor.
By Colin Twiggs
May 16th, 2016 3:00 a.m. EDT (5:00 p.m. AEST)
A weak Dollar, low interest rates and rising inflation in the US all fuel demand for Gold. But I believe that the primary driver is safe-haven demand, driven by expectations of a depreciating Yuan.
Gold flags further gains
Not quite a classic cup and handle pattern, but gold's 2-week flag after a broad saucer through March-April suggests strong buyer interest. Breakout above $1280 would signal a fresh advance. Follow-through above $1300 would confirm.
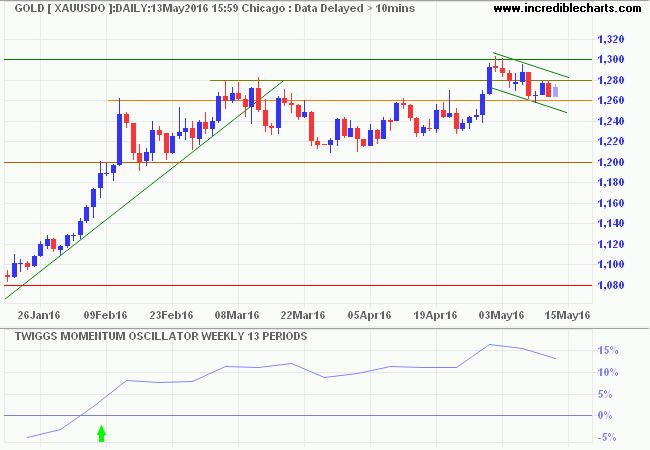
* Target calculation: 1300 + ( 1300 � 1050 ) = 1550
Any weakness of the Yuan would be likely to drive gold through resistance at $1300/ounce, signaling another advance with a long-term target of 1550 (the lows of Sep/Dec 2011 and May 2012).
Disclosure: Our managed portfolios are invested in Australian gold stocks.
The Dollar
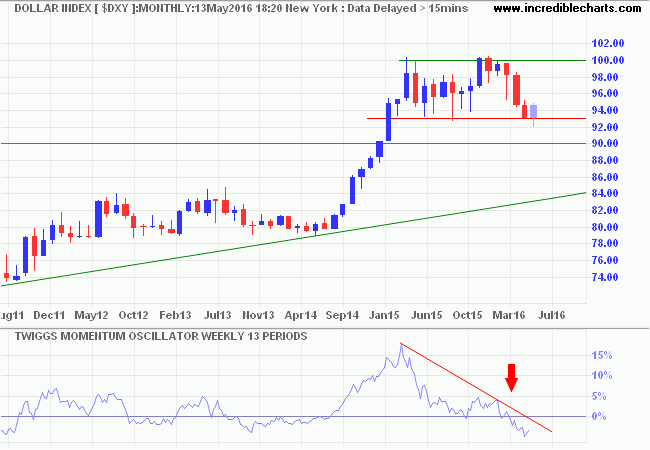
The US Dollar Index rallied off long-term support at 93 but this looks more a pause in the primary down-trend, signaled by decline of 13-week Momentum below zero, than a reversal.
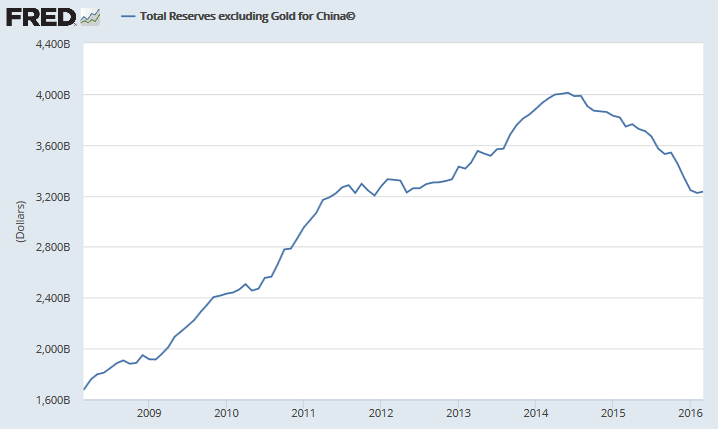
Explanation for the Dollar rally is evident on the chart of China's foreign reserves: a pause in the sharp decline of the last 2 years. China has embarked on another massive stimulus program in an attempt to shock their economy out of its present slump.
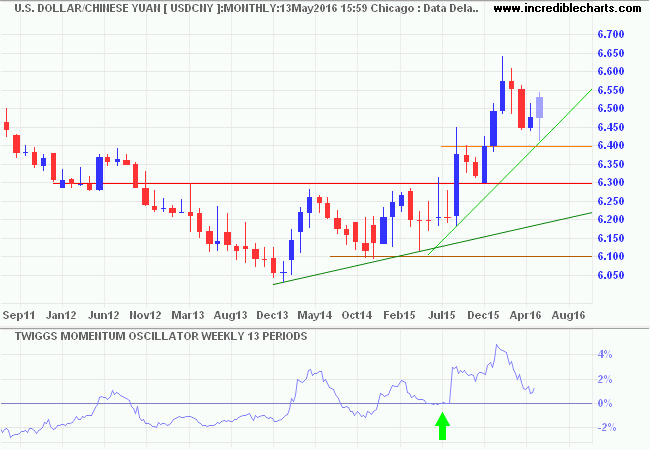
But this hair of the dog remedy is unlikely to solve their problems, merely postpone the inevitable reckoning. The Yuan is once again weakening against the Dollar. Decline in China's reserves, and the US Dollar as a consequence, is likely to continue.
Interest rates and Inflation
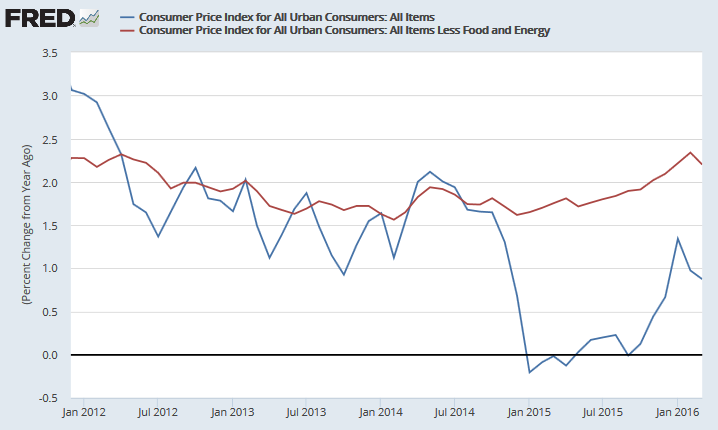
Inflation is giving mixed signals. CPI fell to 0.87% (year-on-year) for March 2016, while Core CPI (excluding energy and food) is a healthy 2.2%. I would have expected the two to converge by now, after the initial oil price fall pushed CPI into negative territory.
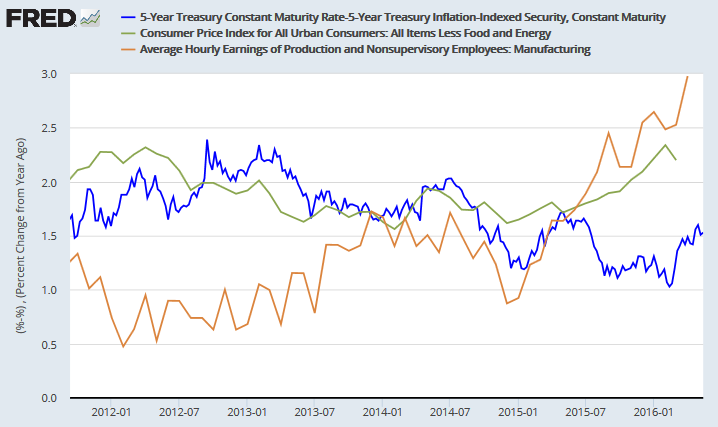
The Five Year Breakeven Rate (Treasury yield minus TIPS) recovered to 1.53%, while growth in the hourly manufacturing earnings rate (production and nonsupervisory employees) rocketed to 2.98%.
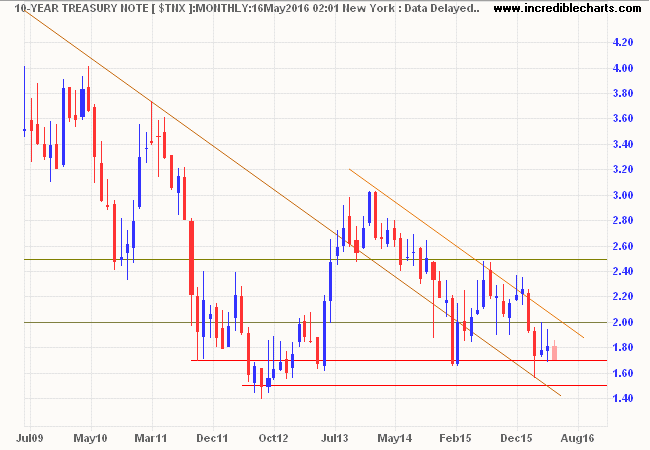
Despite this, long-term interest rates are weak, with 10-year Treasury yields testing support at 1.70 percent. Breach would signal another test of the record low at 1.50% in 2012. Fed softening of their tightening bias may be a contributing factor, but so could safe-haven demand for treasuries for investors wary of stocks....
Doubt is not a pleasant condition, but certainty is absurd.
~ Voltaire
Disclaimer
Porter Private Clients Pty Ltd, trading as Research & Investment ("R&I"), is a Corporate Authorized Representative (AR Number 384 397) of Andika Pty Ltd which holds an Australian Financial Services Licence (AFSL 297069).
The information on this web site and in the newsletters is general in nature and does not consider your personal circumstances. Please contact your professional financial adviser for advice tailored to your needs.
R&I has made every effort to ensure the reliability of the views and recommendations expressed in the reports published on its websites and newsletters. Our research is based upon information known to us or which was obtained from sources which we believe to be reliable and accurate.
No guarantee as to the capital value of investments, nor future returns are made by R&I. Neither R&I nor its employees make any representation, warranty or guarantee that the information provided is complete, accurate, current or reliable.
You are under no obligation to use these services and should always compare financial services/products to find one which best meets your personal objectives, financial situation or needs.
To the extent permitted by law, R&I and its employees, agents and authorised representatives exclude all liability for any loss or damage (including indirect, special or consequential loss or damage) arising from the use of, or reliance on, any information. If the law prohibits the exclusion of such liability, such liability shall be limited, to the extent permitted by law, to the resupply of the said information or the cost of the said resupply.
Important Warning About Simulated Results
Research & Investment (R&I) specialise in developing, testing and researching investment strategies and systems. Within the R&I web site and newsletters, you will find information about investment strategies and their performance. It is important that you understand that results from R&I research are simulated and not actual results.
No representation is made that any investor will or is likely to achieve profits or losses similar to those shown.
Simulated performance results are generally prepared with the benefit of hindsight and do not involve financial risk. No modeling can completely account for the impact of financial risk in actual investment. Account size, brokerage and slippage may also diverge from simulated results. Numerous other factors related to the markets in general or to the implementation of any specific investment system cannot be fully accounted for in the preparation of simulated performance results and may adversely affect actual investment results.
To the extent permitted by law, R&I and its employees, agents and authorised representatives exclude all liability for any loss or damage (including indirect, special or consequential loss or damage) arising from the use of, or reliance on, any information offered by R&I whether or not caused by any negligent act or omission.
