S&P 500 will struggle to break 2100
By Colin Twiggs
April 7, 2016 6:00 p.m. AEST (4:00 a.m. EDT)
Advice herein is provided for the general information of readers and does not have regard to any particular person's investment objectives, financial situation or needs. Accordingly, no reader should act on the basis of any information contained herein without first having consulted a suitably qualified financial advisor.
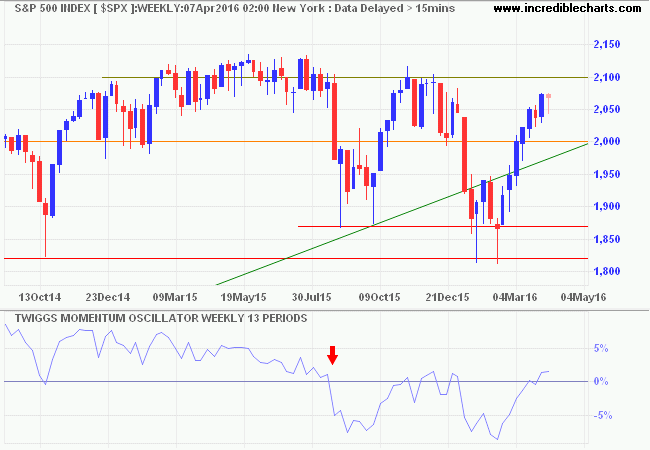
The S&P 500 is headed for a test of resistance at 2100, buoyed by indications that the Fed will not raise interest rates for at least two months. 13-week Twiggs Momentum lifted its nose above the zero line. Not quite a recovery but an improvement on its recent performance. Reversal below 2000, however, would warn of another test of primary support at 1820 to 1870.
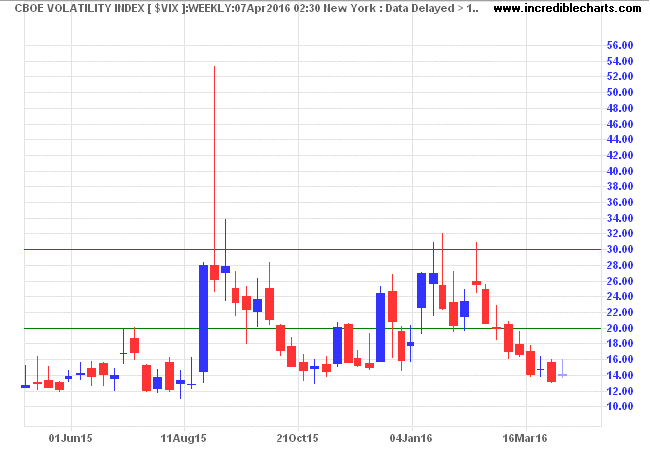
CBOE Volatility Index (VIX) at 14 indicates that (short-term) market risk has eased.
So why the skepticism? To give a balanced view I will start with the positives.
Positive
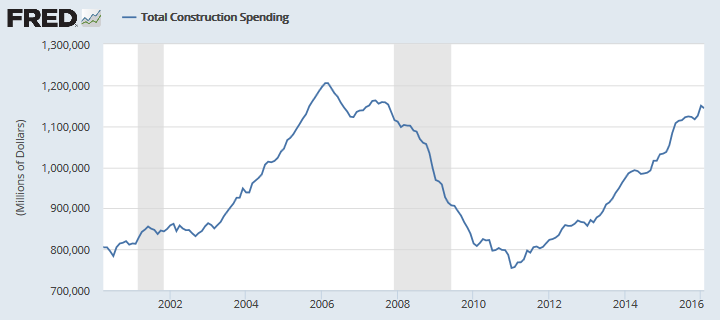
Construction spending is on a tear.
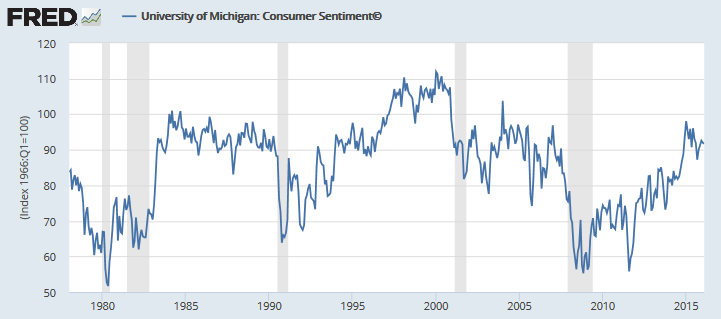
Consumer sentiment is OK.
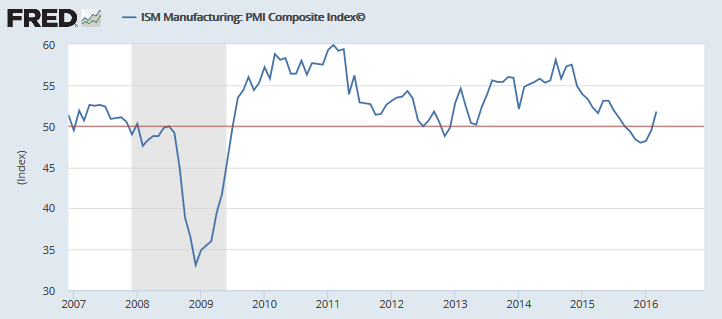
ISM Manufacturing PMI Composite recovered above 50, indicating expansion, after its recent scare.
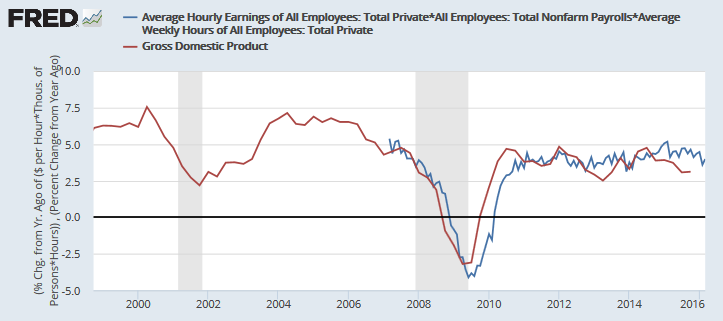
GDP growth is low but expected to hold above 2.5% per year. Here I estimate total weekly earnings of nonfarm employees (blue line) to project the likely path of GDP growth.
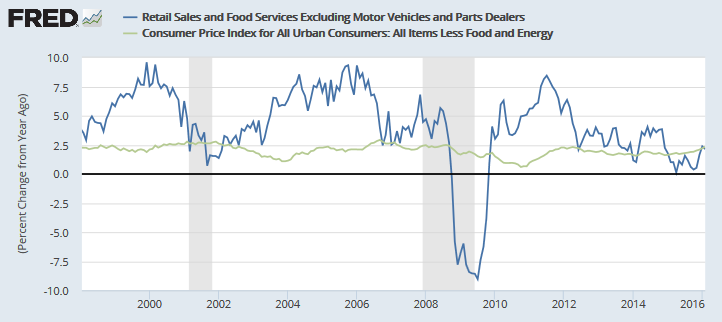
And retail sales growth (ex Autos) is at least matching core inflation after its recent contraction (in real terms).
Not-so-positive
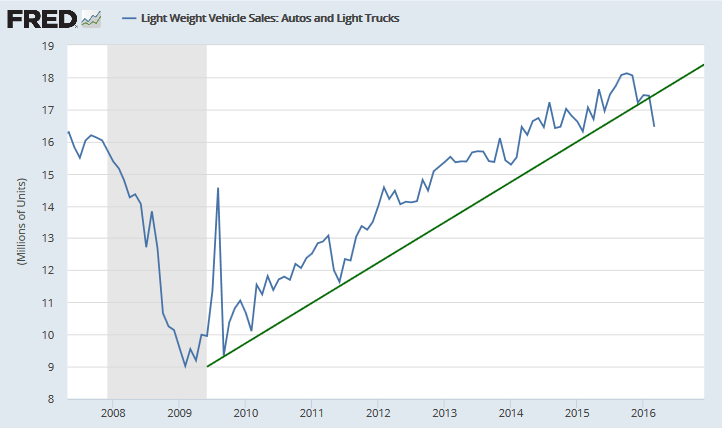
All looks rosy so far, but light vehicle sales — a useful indicator of longer-term consumer confidence — are falling.
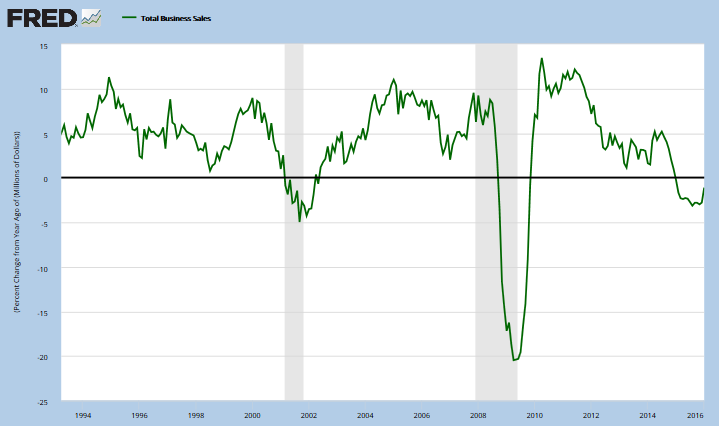
Business sales growth turned up in January but is still below zero.
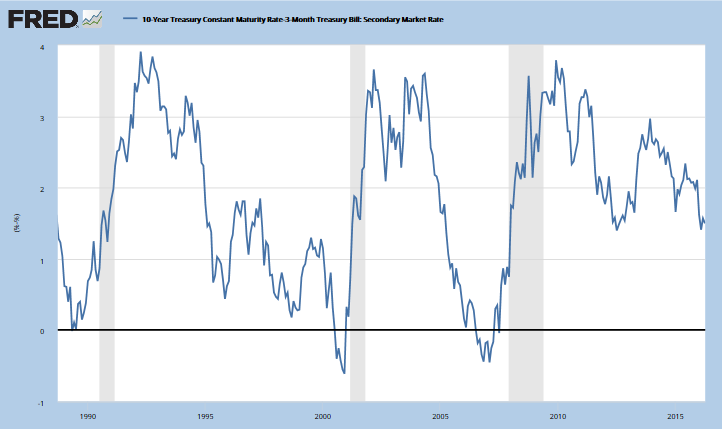
The yield curve is flattening. Illustrated here by the differential between 10-Year and 3-month Treasury yields. If this gets near zero, banks stop lending and a recession (gray bars) soon follows.
You can already see currency growth, measured in real terms after deducting core CPI, starting to fall.
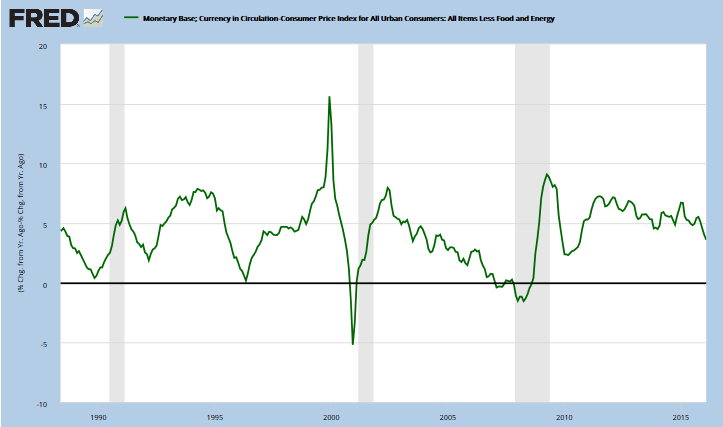
Surely the all-powerful Fed will step in and fix this. Based on past performance, it is likely to register as "Collateral Damage".
Negative
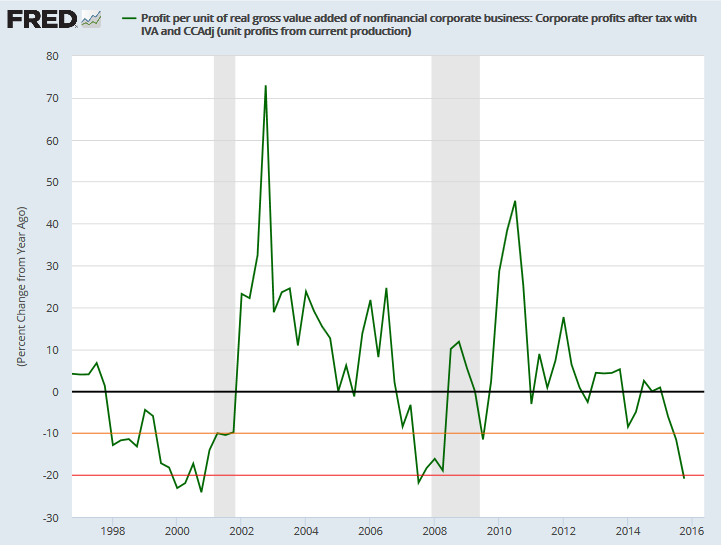
I think we are in for a tough earnings season. Profit margins to the fourth quarter of last year were down 20 percent year-on-year. Note the relationship between this level and past recessions (gray bars).
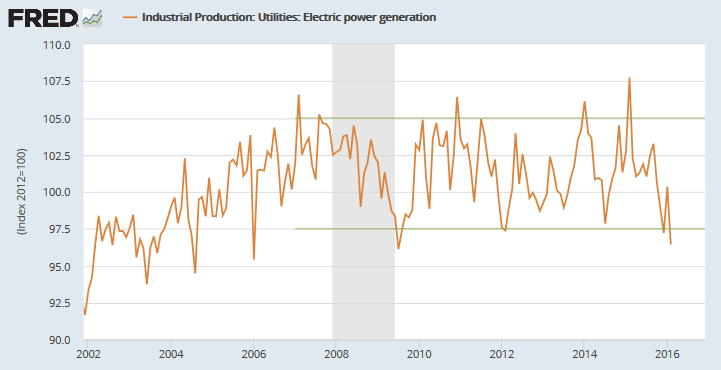
Some activity indicators like electric power generation have recorded nasty falls. That cannot be simply ascribed to an increase in solar panels.
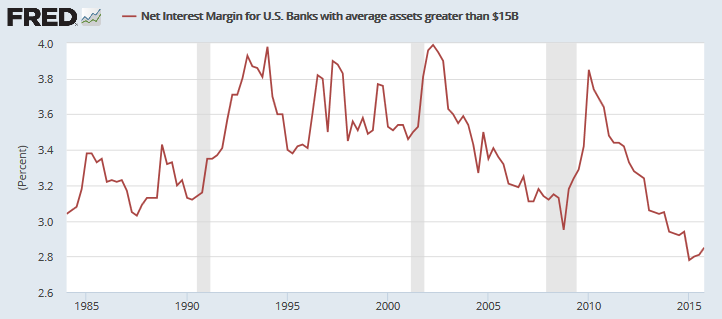
Pressure on the banks is also rising, with the flattening yield curve compressing interest margins. When margins narrow, the risk-reward payoff gets skewered and banks are reluctant to lend, precipitating a contraction.
Well, the earnings season is upon us and will soon either confirm or disprove my bearish view of the market.
A wise man proportions his belief to the evidence.
~ David Hume (1711-1776)
Disclaimer
Porter Private Clients Pty Ltd, trading as Research & Investment ("R&I"), is a Corporate Authorized Representative (AR Number 384 397) of Andika Pty Ltd which holds an Australian Financial Services Licence (AFSL 297069).
The information on this web site and in the newsletters is general in nature and does not consider your personal circumstances. Please contact your professional financial adviser for advice tailored to your needs.
R&I has made every effort to ensure the reliability of the views and recommendations expressed in the reports published on its websites and newsletters. Our research is based upon information known to us or which was obtained from sources which we believe to be reliable and accurate.
No guarantee as to the capital value of investments, nor future returns are made by R&I. Neither R&I nor its employees make any representation, warranty or guarantee that the information provided is complete, accurate, current or reliable.
You are under no obligation to use these services and should always compare financial services/products to find one which best meets your personal objectives, financial situation or needs.
To the extent permitted by law, R&I and its employees, agents and authorised representatives exclude all liability for any loss or damage (including indirect, special or consequential loss or damage) arising from the use of, or reliance on, any information. If the law prohibits the exclusion of such liability, such liability shall be limited, to the extent permitted by law, to the resupply of the said information or the cost of the said resupply.
Important Warning About Simulated Results
Research & Investment (R&I) specialise in developing, testing and researching investment strategies and systems. Within the R&I web site and newsletters, you will find information about investment strategies and their performance. It is important that you understand that results from R&I research are simulated and not actual results.
No representation is made that any investor will or is likely to achieve profits or losses similar to those shown.
Simulated performance results are generally prepared with the benefit of hindsight and do not involve financial risk. No modeling can completely account for the impact of financial risk in actual investment. Account size, brokerage and slippage may also diverge from simulated results. Numerous other factors related to the markets in general or to the implementation of any specific investment system cannot be fully accounted for in the preparation of simulated performance results and may adversely affect actual investment results.
To the extent permitted by law, R&I and its employees, agents and authorised representatives exclude all liability for any loss or damage (including indirect, special or consequential loss or damage) arising from the use of, or reliance on, any information offered by R&I whether or not caused by any negligent act or omission.
