Crude oil and buybacks
By Colin Twiggs
March 17, 2016 7:00 p.m. AEDT (4:00 a.m. EST)
Advice herein is provided for the general information of readers and does not have regard to any particular person's investment objectives, financial situation or needs. Accordingly, no reader should act on the basis of any information contained herein without first having consulted a suitably qualified financial advisor.
At present, stock prices are heavily influenced by the price of crude oil. Whichever direction crude takes, stocks are likely to follow. The current rally in Light Crude (June 2016 Futures) is testing resistance at $42/barrel. Respect would warn of another test of primary support at $32. Breach of $32 would offer a target of $22/barrel* but we are more likely to see further consolidation (between $32 and $42) first.

* Target calculation: 32 - ( 42 - 32 ) = 22
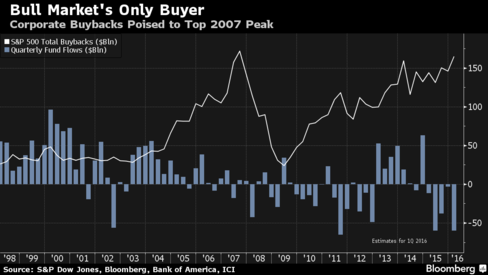
Another major factor influencing prices is corporate buybacks. Lu Wang at Bloomberg points out that inflows/outflows from managed funds are dwarfed by repurchases:
Standard & Poor's 500 Index constituents are poised to repurchase as much as $165 billion of stock this quarter, approaching a record reached in 2007. The buying contrasts with rampant selling by clients of mutual and exchange-traded funds, who after pulling $40 billion since January are on pace for one of the biggest quarterly withdrawals ever.
Of more concern is that we are approaching the March quarter-end. Repurchases are expected to fall dramatically in April.
Global
Dow Jones Global Index continues to test resistance at 300 and the descending trendline. 13-Week Twiggs Momentum continues to flag a strong primary down-trend. Respect of resistance is likely and reversal below 290 would warn of another decline. Breach of 270 would confirm. Penetration of the descending trendline, however, would warn that the down-trend is losing momentum and a bottom is forming.

* Target calculation: 270 - ( 300 - 270 ) = 240
North America
The S&P 500 broke resistance at 2000 and rising 13-week Twiggs Money Flow indicates medium-term buying pressure. Respect of short-term support at 2100 would indicate a rally to 2100. But I remain wary of this rally.

A look at the monthly chart explains why. Respect of 2100, or even a feint (false break) above the previous high of 2170 would keep the weight on the sell side (an outgoing tide). Declining 13-week Twiggs Momentum, below zero, warns of a primary down-trend.

* Target calculation: 1900 - ( 2100 - 1900 ) = 1700
A CBOE Volatility Index (VIX) peak below 20 indicates that (short-term) market risk has eased. But our longer-term risk measures continue to warn of elevated risk.

Canada's TSX 60 is testing resistance at 800. Expect stubborn resistance at the former primary support level. A correction to test support at 700 is likely. Recovery of 13-week Twiggs Momentum above zero would indicate that the primary down-trend has ended. Penetration of the descending trendline suggests that a bottom is forming. A higher trough on the next correction would be a bullish sign.

Europe
Dow Jones Euro Stoxx 50 found resistance at 3100 but bullish divergence on 13-week Twiggs Money Flow suggests that a test of 3300 is likely. The primary trend remains down and a lower peak, followed by reversal below 3000, would warn of decline to 2500*.

* Target calculation: 3000 - ( 3500 - 3000 ) = 2500
Germany's DAX is similarly testing resistance at 10000. Breakout would indicate an advance to 11000. Buying pressure on 13-week Twiggs Money Flow appears secondary. Reversal below 9300 would warn of another decline.

* Target calculation: 9500 - ( 11000 - 9500 ) = 8000
The Footsie found stronger than expected resistance at 6250. Reversal below 6000 would warn of another test of 5500. Breach of the descending trendline suggests that a bottom is forming. A higher trough would favor a reversal. While a trough above zero on 13-week Twiggs Money Flow would strengthen the signal.

* Target calculation: 6000 - ( 6500 - 6000 ) = 5500
Asia
The Shanghai Composite Index is consolidating in a narrow range between 2700 and 2900, suggesting continuation of the primary down-trend.

* Target calculation: 3000 - ( 3600 - 3000 ) = 2400
Japan's Nikkei 225 Index encountered stubborn resistance at 17000. Respect would warn of another test of 15000, while breakout would be likely to encounter further resistance at 18000. 13-Week Twiggs Money Flow holding above zero is encouraging but I expect the primary down-trend is far from over.

* Target calculation: 17000 - ( 20000 - 17500 ) = 15000
India's Sensex is testing resistance at 25000. Rising 13-week Twiggs Money Flow reflects strong (medium-term) buying pressure. Narrow consolidation below resistance suggests breakout is likely, which would test the upper trend channel at 26000. Respect of the trend channel is likely and would warn of another test of 22500*.

* Target calculation: 25000 - ( 27500 - 25000 ) = 22500
Australia
The ASX 200 is testing resistance at 5150 and the descending trendline. Rising 13-week Twiggs Money Flow indicates medium-term buying pressure. This is a bear market and respect of resistance is likely to warn of another decline. Penetration of the descending trendline, however, would warn that a bottom is forming. Reversal below 5000 is likely and would warn of another test of 4700, while breach of 4700 would offer a target of 4400*.

* Target calculation: 4800 - ( 5200 - 4800 ) = 4400
The Banks Index is also testing its descending trendline. Respect is likely and would warn of another decline. Penetration would again suggest that a bottom is forming.

Please give up the idea that the Fed can do what it wants. It looks like it can in the short-run, but in the long run markets do what they want, and the Fed has to respond, rather than lead.
Disclaimer
Porter Private Clients Pty Ltd, trading as Research & Investment ("R&I"), is a Corporate Authorized Representative (AR Number 384 397) of Andika Pty Ltd which holds an Australian Financial Services Licence (AFSL 297069).
The information on this web site and in the newsletters is general in nature and does not consider your personal circumstances. Please contact your professional financial adviser for advice tailored to your needs.
R&I has made every effort to ensure the reliability of the views and recommendations expressed in the reports published on its websites and newsletters. Our research is based upon information known to us or which was obtained from sources which we believe to be reliable and accurate.
No guarantee as to the capital value of investments, nor future returns are made by R&I. Neither R&I nor its employees make any representation, warranty or guarantee that the information provided is complete, accurate, current or reliable.
You are under no obligation to use these services and should always compare financial services/products to find one which best meets your personal objectives, financial situation or needs.
To the extent permitted by law, R&I and its employees, agents and authorised representatives exclude all liability for any loss or damage (including indirect, special or consequential loss or damage) arising from the use of, or reliance on, any information. If the law prohibits the exclusion of such liability, such liability shall be limited, to the extent permitted by law, to the resupply of the said information or the cost of the said resupply.
Important Warning About Simulated Results
Research & Investment (R&I) specialise in developing, testing and researching investment strategies and systems. Within the R&I web site and newsletters, you will find information about investment strategies and their performance. It is important that you understand that results from R&I research are simulated and not actual results.
No representation is made that any investor will or is likely to achieve profits or losses similar to those shown.
Simulated performance results are generally prepared with the benefit of hindsight and do not involve financial risk. No modeling can completely account for the impact of financial risk in actual investment. Account size, brokerage and slippage may also diverge from simulated results. Numerous other factors related to the markets in general or to the implementation of any specific investment system cannot be fully accounted for in the preparation of simulated performance results and may adversely affect actual investment results.
To the extent permitted by law, R&I and its employees, agents and authorised representatives exclude all liability for any loss or damage (including indirect, special or consequential loss or damage) arising from the use of, or reliance on, any information offered by R&I whether or not caused by any negligent act or omission.