Heikin-Ashi Candlesticks, Pivot Points and Displaced Moving Averages
By Colin Twiggs
April 29th, 2015 10:30 p.m. EDT (12:30 p.m. AET)
Three new pages that help to explain some of our latest indicators:
Heikin Ashi Candlesticks
Heikin Ashi candlesticks filter out market noise from the traditional Japanese candlestick chart and highlight trend and/or consolidation patterns.
Trading Signals
Signals should be interpreted in the same way as on traditional candlestick charts. Long candles indicate a strong trend, while doji candles and spinning tops indicate consolidation that may warn of a reversal.
Example
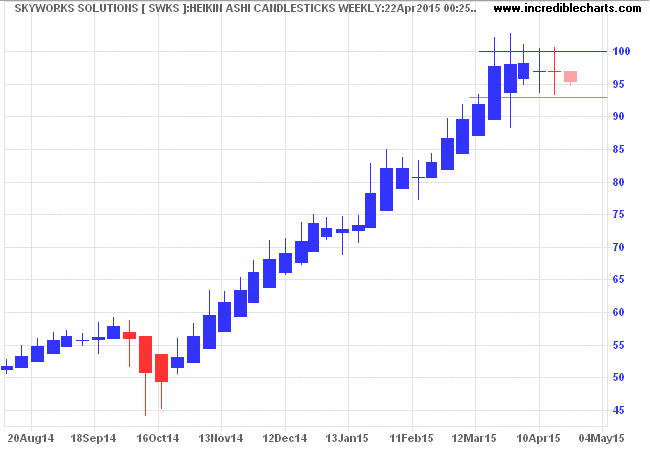
Skyworks Solutions (SWKS) Pivot Point is first plotted with weekly Heikin-Ashi candlesticks.
And then with traditional Japanese candlesticks (weekly).
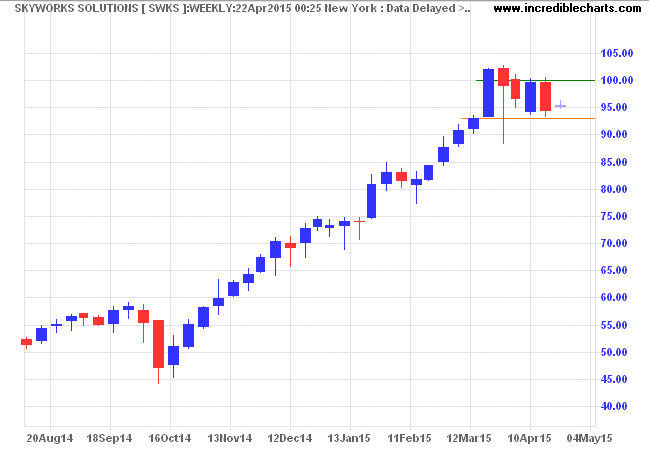
Heikin-Ashi candlesticks give a clearer depiction of the trend from late October 2014 and also of resistance at the $100 mark.
Heikin-Ashi Candlesticks Formula
Heikin-Ashi Candlesticks are calculated using smoothed values for Open, High, Low and Close:
- Heikin-Ashi Close is the average of Open, High, Low and Closing Price for the period.
- Heikin-Ashi Open is the average of the Heikin Ashi Open and Close for the previous candle.
- Heikin-Ashi High is the highest of three points for the current period:
- The High
- Heikin-Ashi Open
- Heikin-Ashi Close
- Heikin-Ashi Low is the lowest of three points for the current period:
- The Low
- Heikin-Ashi Open
- Heikin-Ashi Close
Pivot Points
Pivot points are useful for identifying significant support and resistance levels and for identifying bearish or bullish market sentiment. Pivot Points were popularized by exchange floor traders who needed short-term predictive tools which can be adapted in a fast-moving trading environment. Pivot Points and support and resistance levels are calculated at the start of each day, based on the high, low and close of the previous day, and are used to guide trading strategy through the day.
Trading Signals
The Pivot Point is the strongest support/resistance level, with weaker levels at S1, S2 and R1, R2. The same level will act as support when price descends from above and as resistance if approached from below.
Example
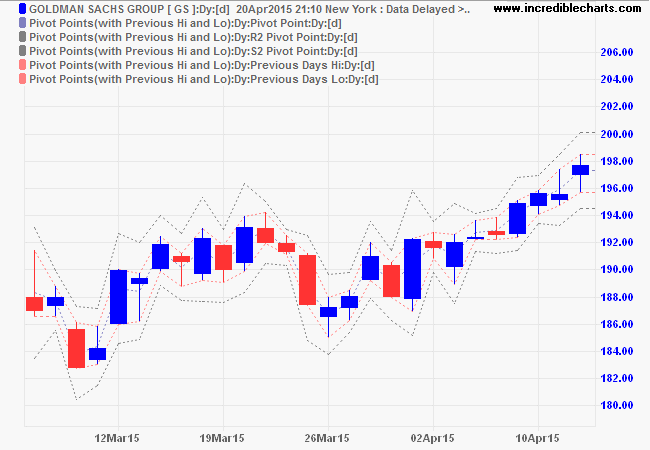
Goldman Sachs Group (GS) Pivot Point is calculated as 197.307 using the High, Low and Close from April 14th, 2015. Secondary levels are the High and Low from the 14th and R2 and S2 as explained below.
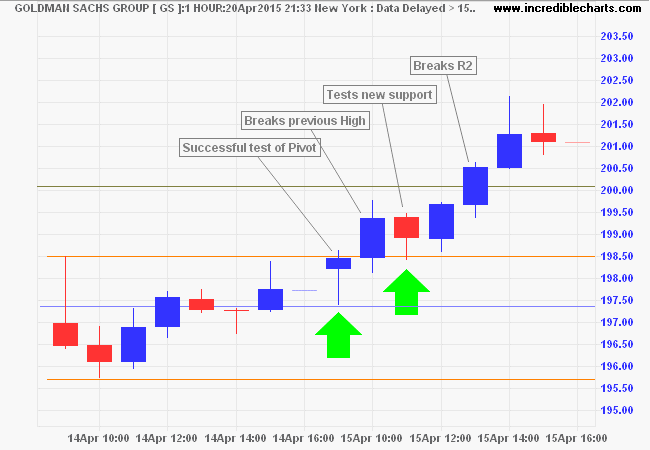
Trading for the 15th is reflected on an hourly chart. Price opens near the previous High before retracing to test support at the Pivot Point. Respect of support sets a bullish tone for the day's trading and is followed by a break of resistance at the previous day's High. Resistance then becomes support as the previous High is successfully tested, signaling further gains. The advance then breaks resistance at R2 before ending with profit-taking (tall shadows/wicks on the last two candles) at the close.
Pivot Point Formula
Several methods of calculating Pivot Points have evolved over the years, but we will stick to the Standard Method:
- The Pivot Point is the average of the previous High, Low and Closing Price.
- Resistance level 2 (R2) = Pivot Point + (High - Low)
- Support level 2 (S2) = Pivot Point - (High - Low)
- Resistance level 1 (R1) = Pivot Point x 2 - Low
- Support level 1 (S1) = Pivot Point x 2 - High
I prefer to use High and Low for the previous period in place of R1 and S1. The two sets of levels are reasonably close, but Previous High and Low is simpler and less contrived. This is offered as an alternative to the Standard Version with R1 and S1 on the indicator panel.
Displaced Moving Averages
Displaced Moving Averages are useful for trend-following, reducing the number of whipsaws compared to an equivalent Exponential or Simple Moving Average.
Trading Signals
Displaced Moving Average generates signals when price crosses the moving average:
- Go long when price crosses to above the Displaced Moving Average from below.
- Go short when price crosses to below the Displaced Moving Average from above.
Example
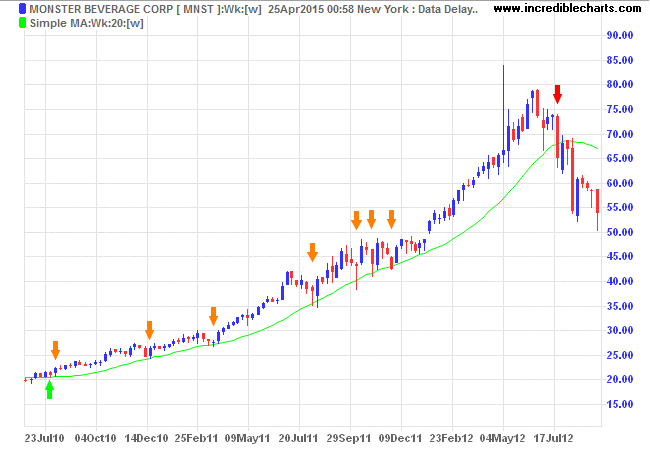
Monster Beverage Inc. (MNST) is plotted with a 20-week Simple Moving Average to follow the 2010 to 2012 primary up-trend. The trend is exited just below $68 in July 2012, but there are 7 whipsaws (exit and re-entry) over the period.
Displacing the moving average allows us to minimize the number of whipsaws. Three Displaced Moving Averages are displayed:
- 15-Week displaced by 5 weeks;
- 13-Week displaced by 7 weeks; and
- 10-Week displaced by 10 weeks.
The sum of the Moving Average Period and the Displacement Period in each case adds up to the same 20 weeks as used in the original trend-following moving average. Increasing the Displacement Period reduces responsiveness (or slows the Displaced MA) more than the compensating decrease in the MA Time Period.
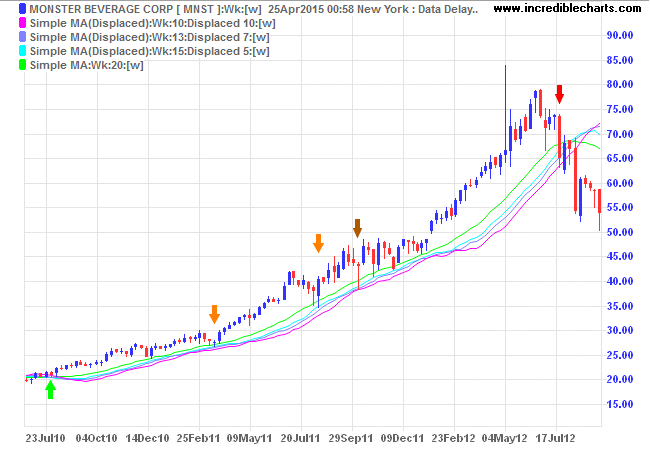
The trade-off of a lower exit price is outweighed by transaction and slippage costs saved from avoiding whipsaws.
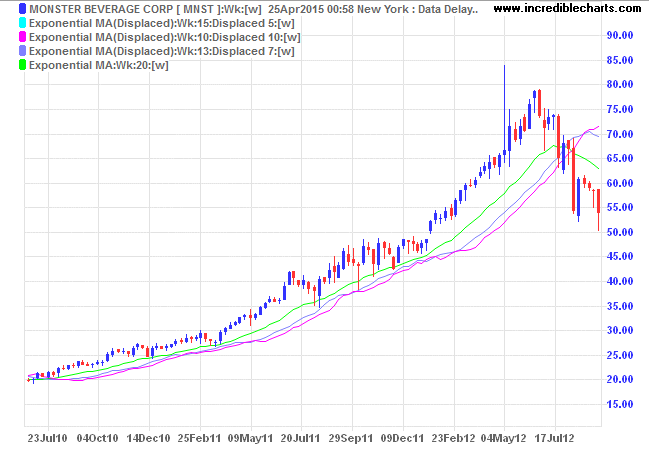
Exponential Moving Averages are said to produce better results (than Simple Moving Averages) for long-term trend-following purposes, but if there is an improvement it is marginal.
Setup
- Select
Indicators in the chart menu. - Select Moving Average (Displaced) in the left column of the Indicator Panel.
- Select your settings in the center panel:
- Daily or Weekly;
- Moving Average Time Period;
- Displacement (use a +number for lag); and
- Moving Average Type (normally Simple or Exponential).
- Save the indicator to the right column [>>].
See Indicator Panel for further directions.
Displaced Moving Averages are also available for Open, High and Low prices, but these would normally only be used to increase short-term responsiveness.
Displaced Moving Average Formula
Calculate an Exponential or Simple Moving Average. Shift the Moving Average a set number of periods to the left or right.
- A shift to the right (using a +number for lag) will effectively lag the moving average (as displayed above) — so that the displaced moving average is calculated several periods ahead of the corresponding bar/candle.
- A shift to the left (-lag) is seldom used and will effectively advance the moving average — so that the displaced moving average is only calculated several periods after the corresponding bar/candle.
Thank you for your support.
The secret of happiness is freedom, and the secret of freedom is courage.
~ Thucydides