Is the S&P 500 overvalued?
By Colin Twiggs
March 27th, 2014 4:30 a.m. EDT (7:30 p:m AEDT)
Please note the recent changes to our Privacy Policy.
These extracts from my trading diary are for educational purposes. Any advice contained therein is provided for the general information of readers and does not have regard to any particular person's investment objectives, financial situation or needs and must not be construed as advice to buy, sell, hold or otherwise deal with any securities or other investments. Accordingly, no reader should act on the basis of any information contained therein without first having consulted a suitably qualified financial advisor. Full terms and conditions can be found at Terms of Use.
The daily press appears convinced the S&P 500 is overvalued and due for a crash. Yet the macro-economic and volatility filters that we use at Porter Capital and Research & Investment — to identify market risk so that we can move to cash when risks are elevated — show no signs of stress. So I have been delving into some of the aggregate index data, kindly provided by Standard and Poors, to see whether some of their arguments hold water.
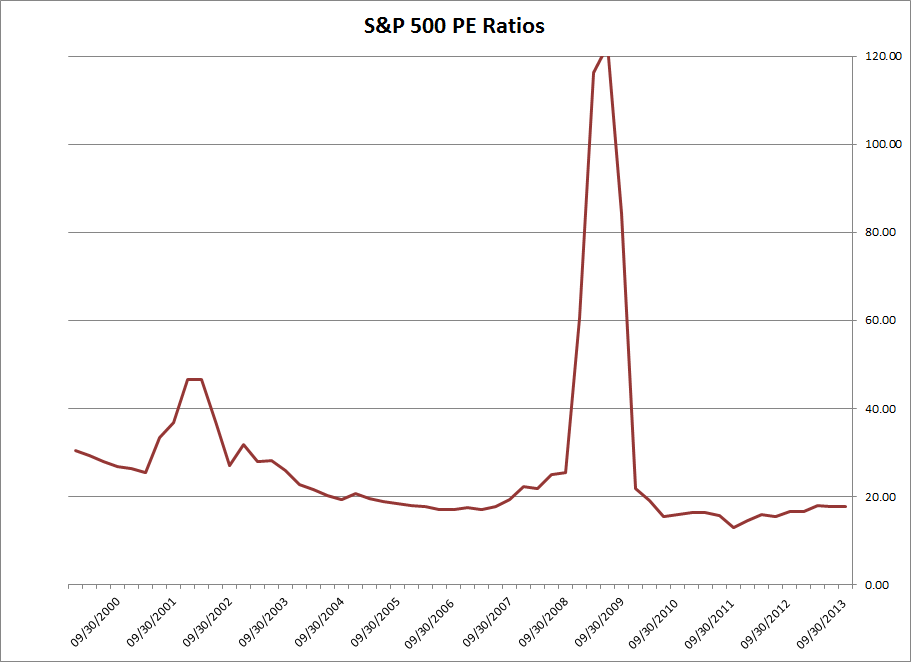
The Price-Earnings ratio for the S&P 500 itself is not excessive when compared to the last decade.

The bears argue, however, that earnings are unsustainable. One reason advanced for this is that earnings growth has outstripped sales, with corporations focusing on the bottom line rather than business growth.
Faced with weak domestic demand, large US corporates have actively sought to manage their expenses so as to meet and exceed the market's expectations. Combined with the unwinding of provisions taken in the GFC, cost management has allowed US corporates to achieve a 124% increase in 12-month trailing earnings off the back of a 25% increase in 12-month trailing sales since October 2009.
~ Elliott Clarke, Westpac
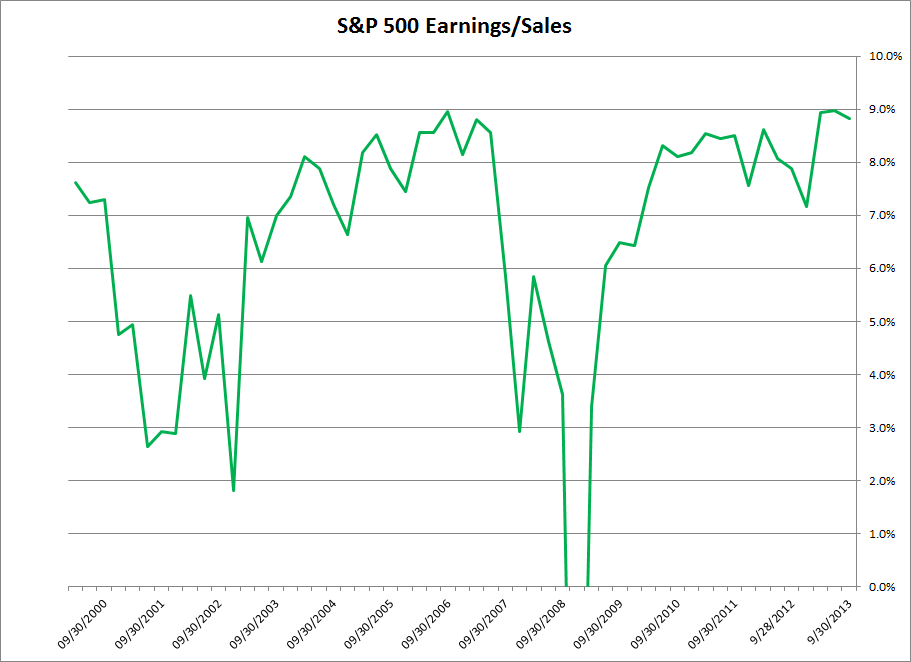
That may be so, but any profit increase would look massive if compared to earnings in 2009. When we plot earnings against sales (per share), it tells a different story. Earnings as a percentage of sales is in the same band (7% - 9%) as 2003 to 2006. A rise above 9% would suggest that earnings may not be sustainable, but not if they continue in their current range.

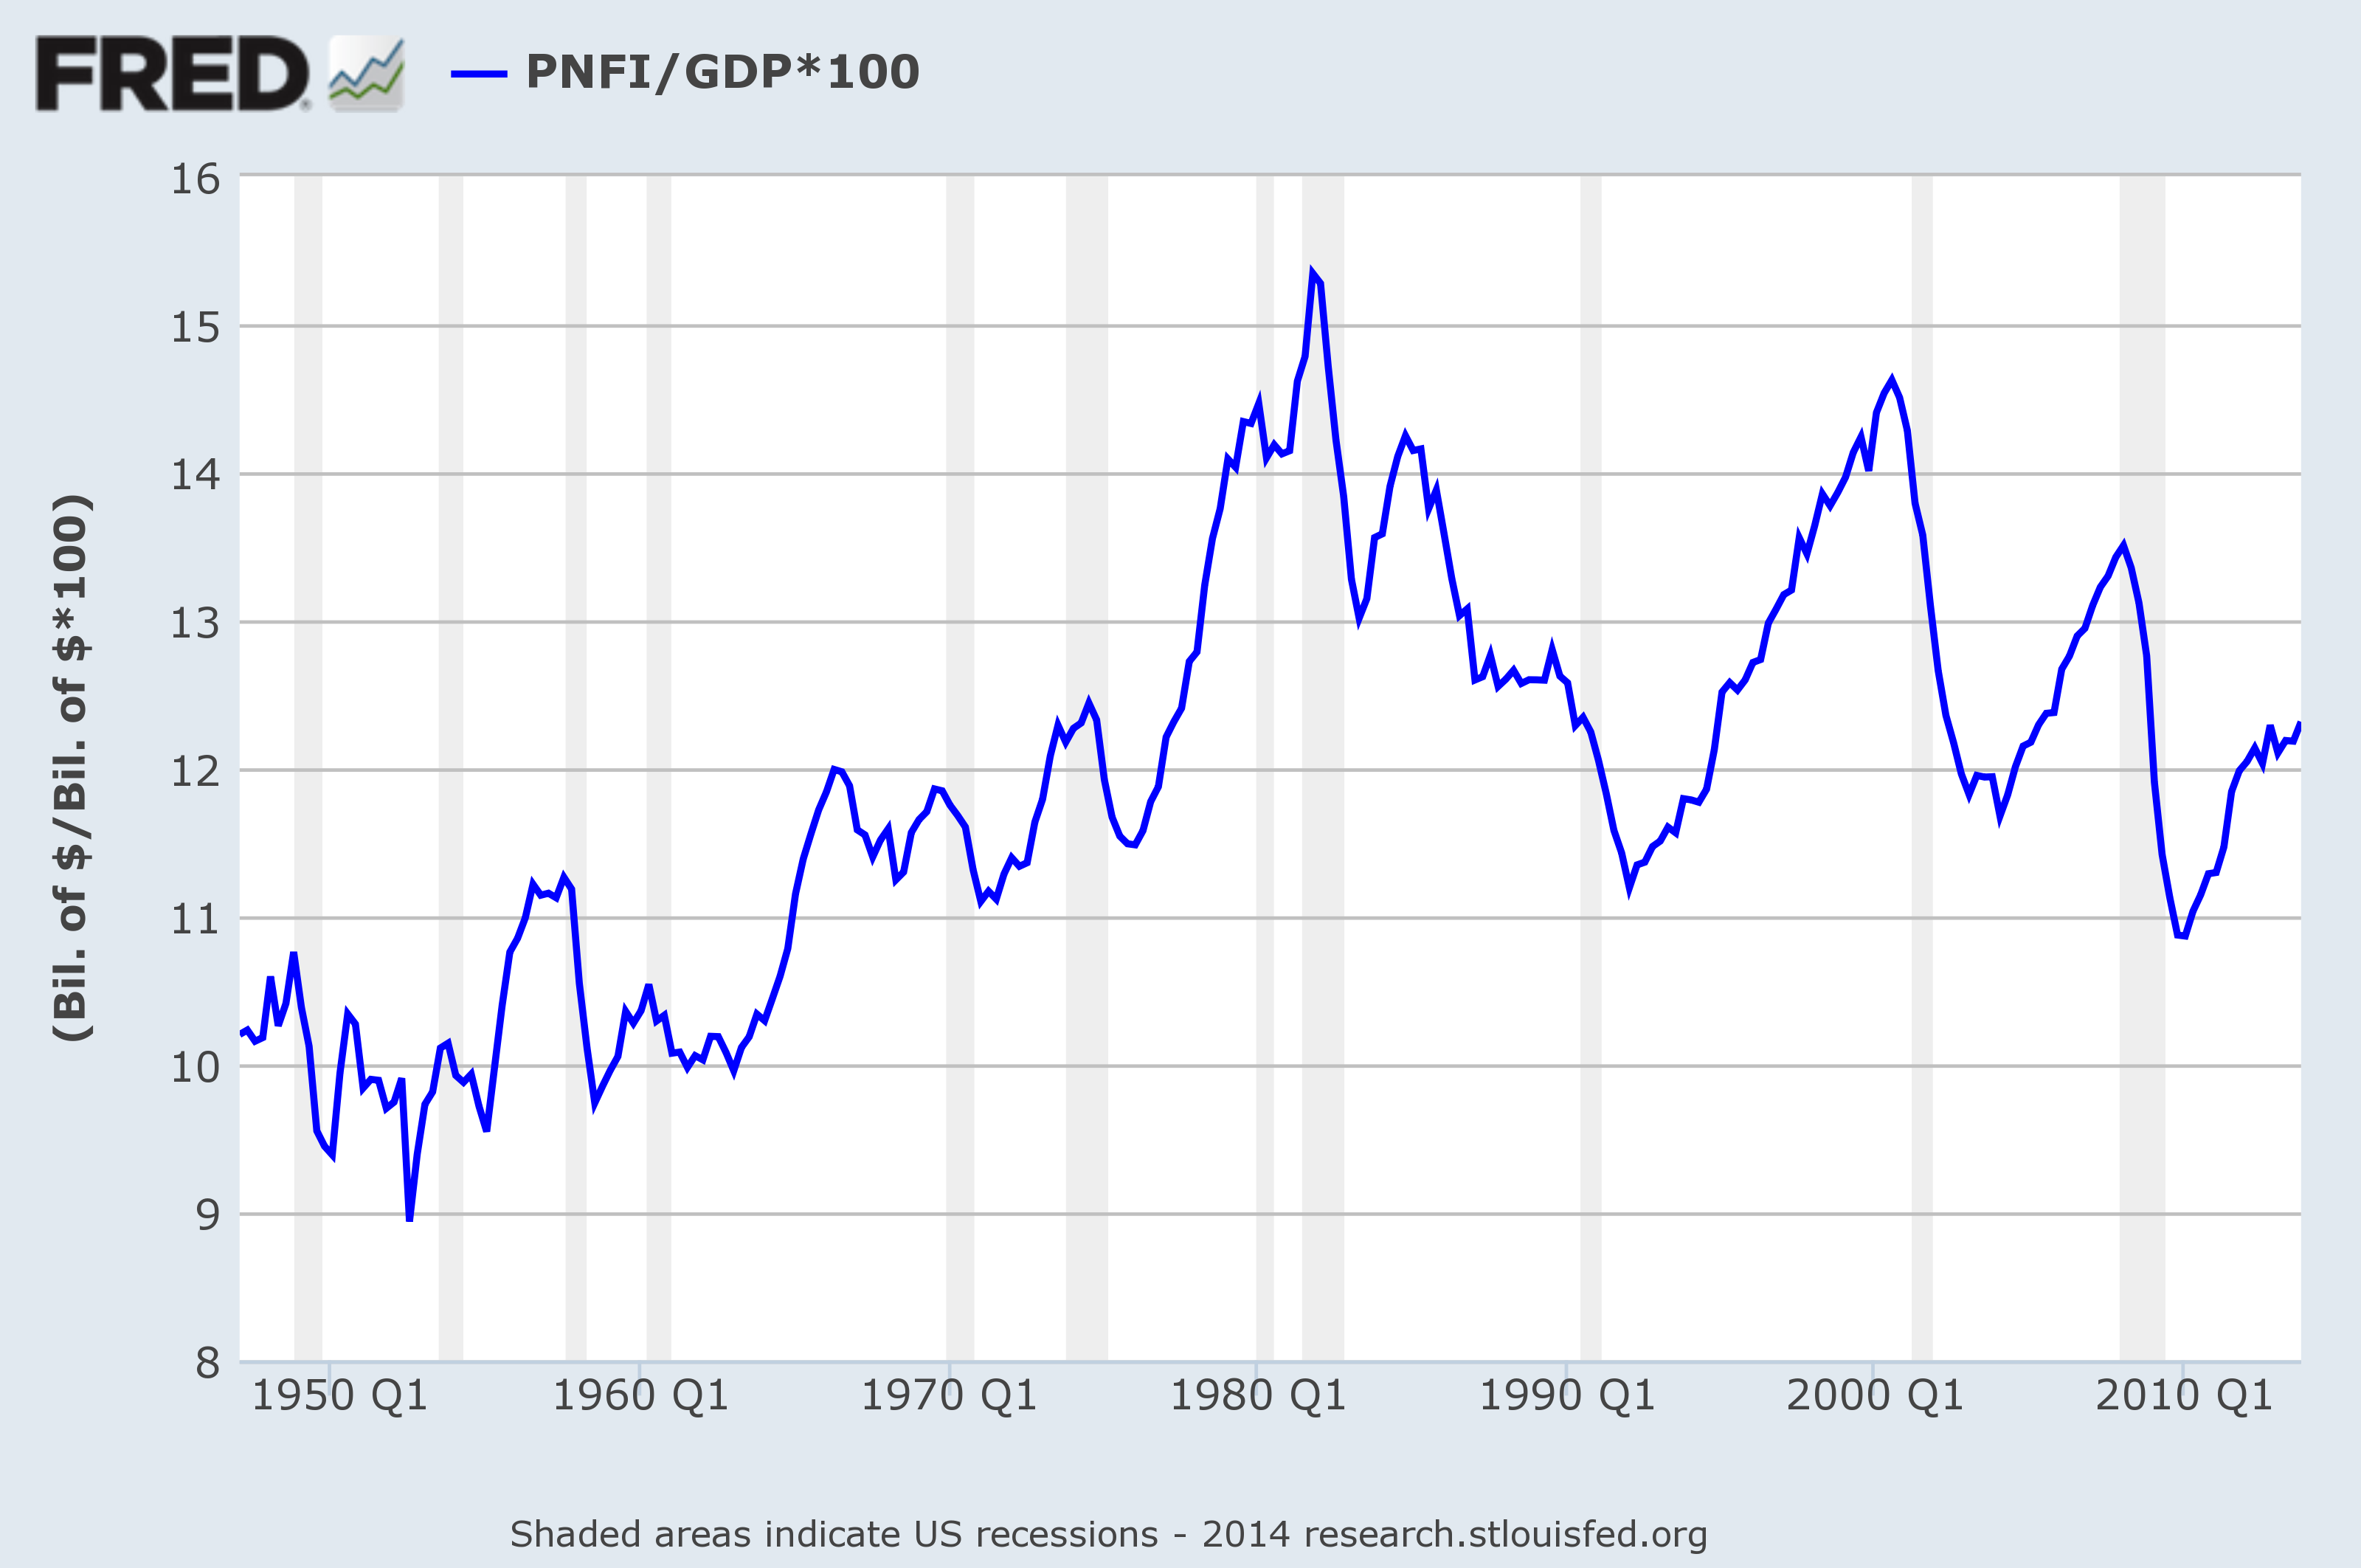
The second reason advanced is that business investment is falling. Westpac put up a chart that shows US equipment investment growth is close to zero. But we also need to consider that accelerated tax write-offs led to a surge in investment in 2009/2010. The accelerated write-offs expired, but the level of investment merely stopped growing and has not fallen as I had expected.

Private (non-residential) fixed investment as a whole is rising as a percentage of GDP, not falling.

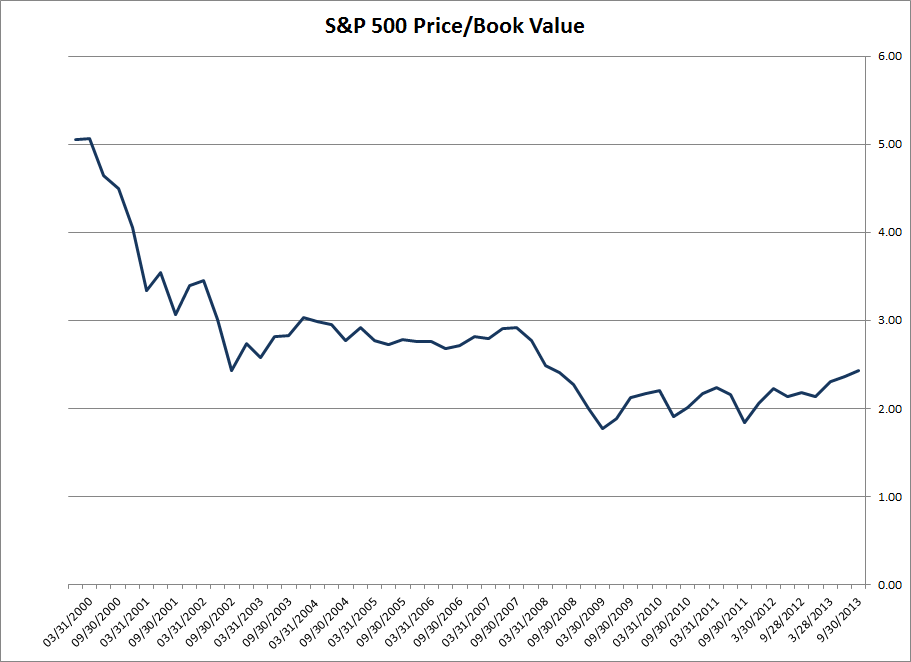
Lastly, when we compare the S&P 500 to underlying net asset value per share, it shows how frothy the market was before the Dotcom crash, with the index trading at 5 times book value. That kind of premium is clearly unsustainable without double-digit GDP growth, which was never going to happen. But the current ratio of below 2.50 is modest compared to the past decade and quite sustainable.

I am not saying that everything is rosy — it never is — but if sales and earnings continue to grow apace, and with private fixed investment rising, the current price-earnings ratio does not look excessive.
More....
It never was my thinking that made the big money for me. It always was my sitting. Got that? My sitting tight! It is no trick at all to be right on the market. You always find lots of early bulls in bull markets and early bears in bear markets. I've known many men who were right at exactly the right time, and began buying or selling stocks when prices were at the very level which should show the greatest profit. And their experience invariably matched mine—that is, they made no real money out of it. Men who can both be right and sit tight are uncommon.
~ Jesse Livermore
