What's New: Ichimoku Cloud
By Colin Twiggs
March 15th, 2014 1:00 a.m. EDT (4:00 p.m. AEDT)
These extracts from my trading diary are for educational purposes. Any advice contained therein is provided for the general information of readers and does not have regard to any particular person's investment objectives, financial situation or needs and must not be construed as advice to buy, sell, hold or otherwise deal with any securities or other investments. Accordingly, no reader should act on the basis of any information contained therein without first having consulted a suitably qualified financial advisor. Full terms and conditions can be found at Terms of Use.
It has been a while since we added new indicators to Incredible Charts, so I am pleased to announce the addition of Ichimoku Cloud in our latest Beta release.
Ichimoku Cloud
Ichimoku Cloud (or Ichimoku Kinko Hyo) is a technical anlysis method that combines leading and lagging indicators with traditional candlestick charts in order to provide a comprehensive trading system. Developed by Japanese journalist Goichi Hosoda in the 1960s, Ichimoku Kinko Hyo is translated as "one balance equilibrium chart", while the common name of Ichimoku Cloud refers to its appearance. Ichimoku can be displayed as a separate indicator in Minute, Hourly, Daily, Weekly or Monthly format.
Ichimoku Cloud Formula
Ichimoku Cloud consists of 5 lines plotted on the Candlestick chart:
Tenkan-Sen
Often referred as the Conversion Line, Tenkan-Sen is simply the mid-point of the latest 9 trading days/periods — the average of a 9-day High and 9-day Low on a daily chart.
Kijun-Sen
Kijun-Sen, or Base Line, is the mid-point of the latest 26 trading days/periods. The two lines (Tenkan-Sen and Kijun-Sen) are used in a similar fashion to fast and slow moving averages.
The "Cloud" itself consists of two leading moving averages:
Senkou Span A
Senkou Span A is the mid-point between the first two lines, Tenkan-Sen and Kijun-Sen, but plotted 26 days/periods ahead of the current period.
Senkou Span B
Senkou Span B is the mid-point between a 52-period High and a 52-period Low and is also plotted 26 days/periods in the future (ahead of the current day).
Last is the lagging indicator:
Chikou Span
Chikou Span is simply the Closing Price, but plotted 26 days/periods in the past.
Ichimoku Cloud Trading Signals
The Cloud: Finding the Trend
The trend is upward when price is above the Cloud.
The trend is downward when price is below the Cloud.
The trend is flat (undetermined) when price is in the Cloud.
The Cloud is green when Senkou Span A is above Span B. A predominantly green cloud indicates a strong up-trend (or weak down-trend), while a predominantly red cloud indicates a strong down-trend (or weak up-trend).
Trading in an Up-trend
Signals above a green Cloud are stronger than signals above a red Cloud.
Go long when Tenkan-Sen (blue) crosses above Kijun-Sen (red).
Go long when Price crosses above the Kijun-Sen (red) line.
Exit when Price crosses below Kijun-Sen (red).
Exit when Tenkan-Sen (blue) crosses below Kijun-Sen (red).
Trading in a Down-trend
Signals below a red Cloud are stronger than signals below a green Cloud.
Go short when Tenkan-Sen (blue) crosses below Kijun-Sen (red).
Go short when Price crosses below the Kijun-Sen (red) line.
Exit when Price crosses above Kijun-Sen (red).
Exit when Tenkan-Sen (blue) crosses above Kijun-Sen (red).
Example 1
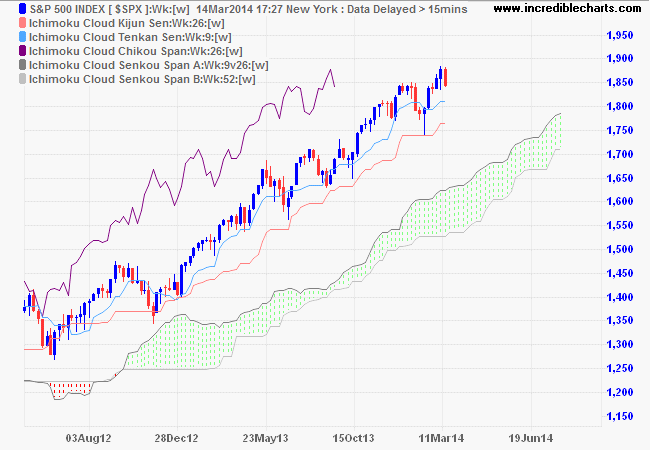
The S&P 500 index is plotted on a weekly chart with Ichimoku Cloud.
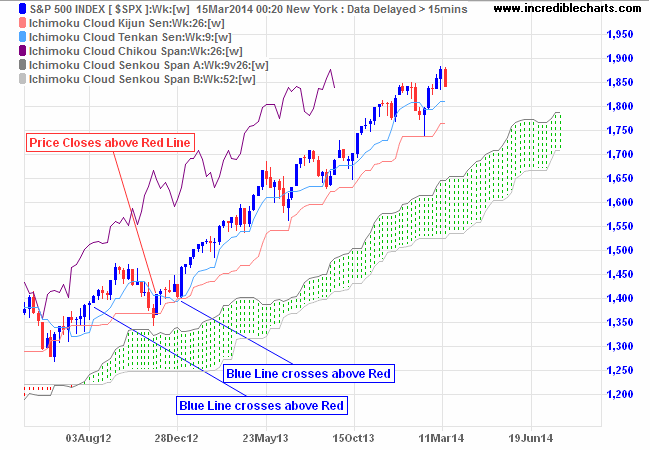
Price above the Cloud indicates an up-trend. The first buy signal is when the blue line (Tenkan-Sen) crosses above the red (Kijun-Sen), after the green Cloud indicates the trend is firmly established. The second long entry (if pyramiding) is when Price closes above the red (Kijun-Sen) line. Again, the green cloud indicates an established trend. A third entry signal is available when the blue line (Tenkan-Sen) again crosses above the red (Kijun-Sen). Exit if Price closes below the red line (Kijun-Sen) — or the blue line (Tenkan-Sen) crosses below the red.
Example 2
Etrade Financial Corporation [ETFC] is plotted on a daily chart with Ichimoku Cloud.
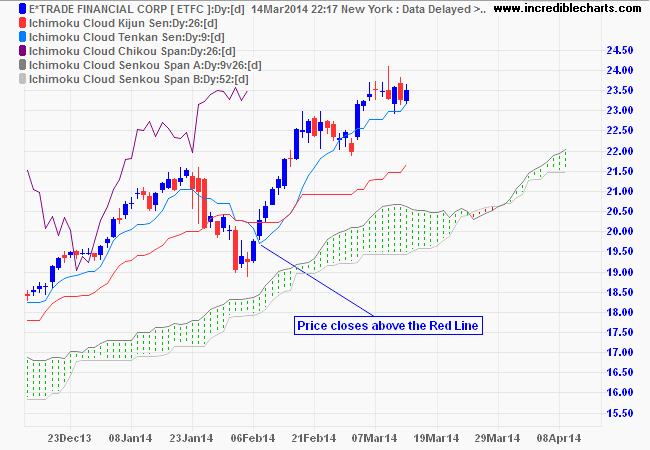
Price above the Cloud indicates an up-trend. Enter long when Price closes above the red (Kijun-Sen) line. The green cloud indicates an established trend. Exit if Price closes below the red line (Kijun-Sen) or the blue line (Tenkan-Sen) crosses below the red.
In a Strong Trend
How to identify a strong trend: the blue line does not cross below the red.
In a strong trend, short-term traders may find that crosses of the red (Kijun-Sen) line are few and far between. Consider long entries where Price closes above the blue (Tenkan-Sen) line and short entries (in a down-trend only) when Price closes below the line.
Example 3
Netflix [NFLX] is plotted on a weekly chart with Ichimoku Cloud.
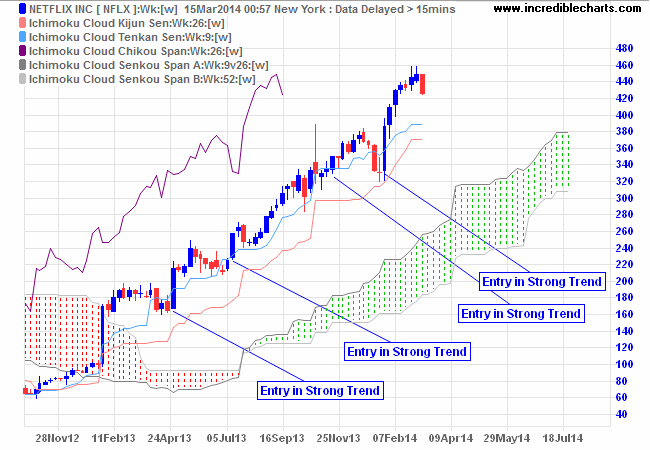
Price above the Cloud indicates an up-trend. The blue line (Tenkan-Sen) holding above the red (Kijun-Sen) indicates a strong trend. Enter when Price dips below and then closes back above the blue line. Exit if Price closes below the red line (Kijun-Sen) or the blue line (Tenkan-Sen) crosses below the red.
Long-term Buy/Sell Signals
Not used as much, but if the purple line (Chikou) crosses above Price, that is a long-term buy signal, while a cross below Price is a long-term sell signal.
Ichimoku Cloud Setup
Select Indicators and Ichimoku Cloud in the left column of the Indicator Panel. See Indicator Panel for directions on how to set up an indicator. To alter the default settings - Edit Indicator Settings.
Ichimoku Cloud Colors
Open the legend by clicking "L" on the toolbar or typing "L" on your keyboard. Adjust individual colors by selecting the color patches next to each indicator line in the legend.
In all history there is no war which was not hatched by the governments, the governments alone, independent of the interests of the people, to whom war is always pernicious even when successful.
~ Leo Tolstoy