Gold and silver bottom?
By Colin Twiggs
February 6th, 2013 12:30 a.m. ET (4:30 p:m AEDT)
These extracts from my trading diary are for educational purposes. Any advice contained therein is provided for the general information of readers and does not have regard to any particular person's investment objectives, financial situation or needs and must not be construed as advice to buy, sell, hold or otherwise deal with any securities or other investments. Accordingly, no reader should act on the basis of any information contained therein without first having consulted a suitably qualified financial advisor. Full terms and conditions can be found at Terms of Use.
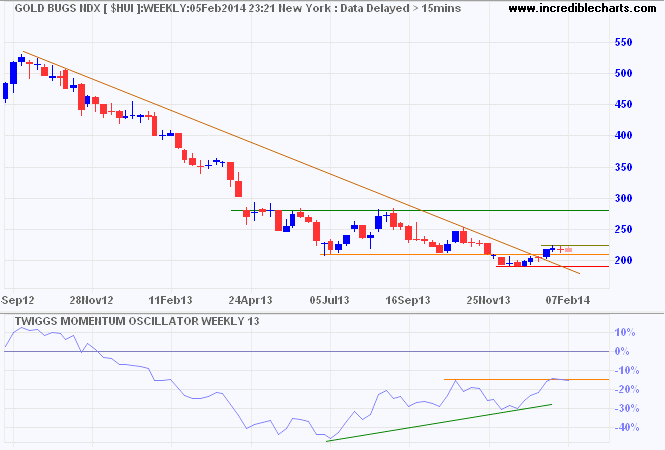
The Gold Bugs Index broke its descending trendline on the weekly chart and shows a bullish divergence on 13-week Twiggs Momentum. Both suggest reversal to a primary up-trend, but first we are likely to see a re-test of support at 190. Respect of 190 followed by recovery above the recent high at 225 would strengthen the reversal signal.

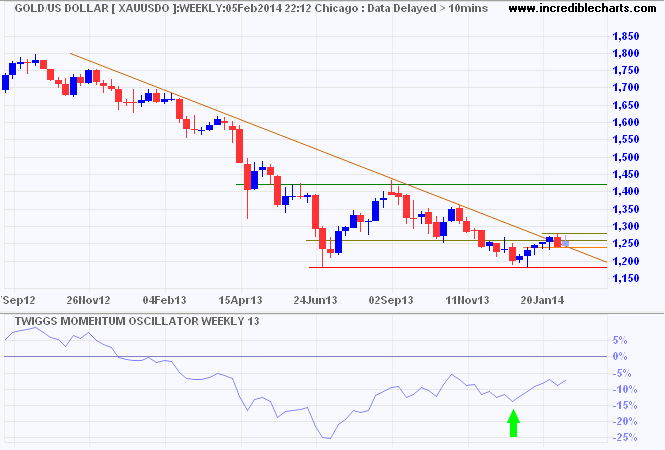
Spot gold displays a similar penetration of the descending trendline and bullish divergence on 13-week Twiggs Momentum, suggesting that a bottom is forming. Follow-through above 1280 would strengthen the signal. Reversal below 1240, however, would warn of another test of primary support at 1180. Breach of 1180 is unlikely, but would offer a target of 1000*.

* Target calculation: 1200 - ( 1400 - 1200 ) = 1000
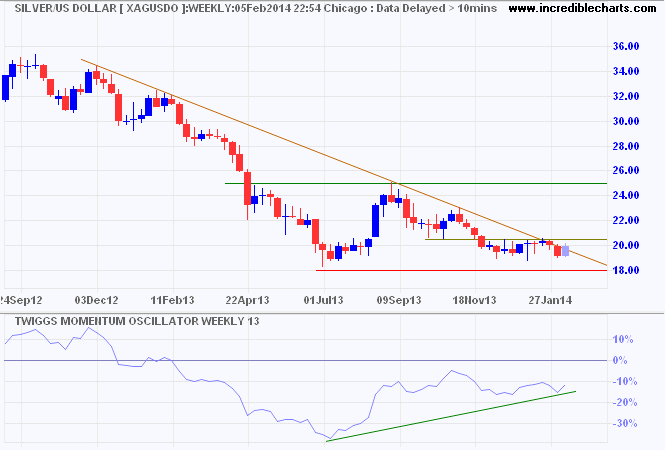
The silver chart, consolidating above primary support at $18/ounce, is mimicking gold. Recovery above $20.50 would also suggest that a bottom is forming.

Markets are fundamentally volatile. No way around it. Your problem is not in the math. There is no math to get you out of having to experience uncertainty.
~ Ed Seykota
