Research & Investment: New Joint Venture
By Colin Twiggs
November 19th, 2013 2:00 am ET (8:00 pm AEDT)
I am pleased to announce the establishment of Research & Investment, a joint venture between Incredible Charts and Porter Capital.
Research & Investment
Research & Investment offers investors a second alternative to accessing the research and investment strategies developed by Dr Bruce Vanstone and me:
- Porter Capital manage funds for high net worth investors and independent financial advisers;
- Research & Investment provide investment strategies for DIY investors.
The active strategies are suitable for lower tax vehicles such as self-managed or self-directed superannuation, pension or retirement funds. The strategies may also suit members of large industry or retail superannuation/pension funds that offer Direct Investment options, where members are able to select individual stocks for their portfolio.
Monthly Subscriptions
Subscribers receive monthly investment updates offering selections of top-performing S&P 500 and ASX 200 stocks using Twiggs Momentum, plus alerts when market risk is identified as elevated.
Limited Subscriptions
Subscription numbers are limited, to 2500 for the S&P 500 and 500 for the ASX 200, in order to protect performance.
Momentum Strategies
The strategies use Twiggs Momentum to identify top-performing stocks in anticipation of continued outperformance. Since its initial discovery by DeBondt & Thaler in 1985, the momentum effect has been documented and researched in many markets worldwide: stocks which have outperformed in the recent past tend to continue to perform strongly.
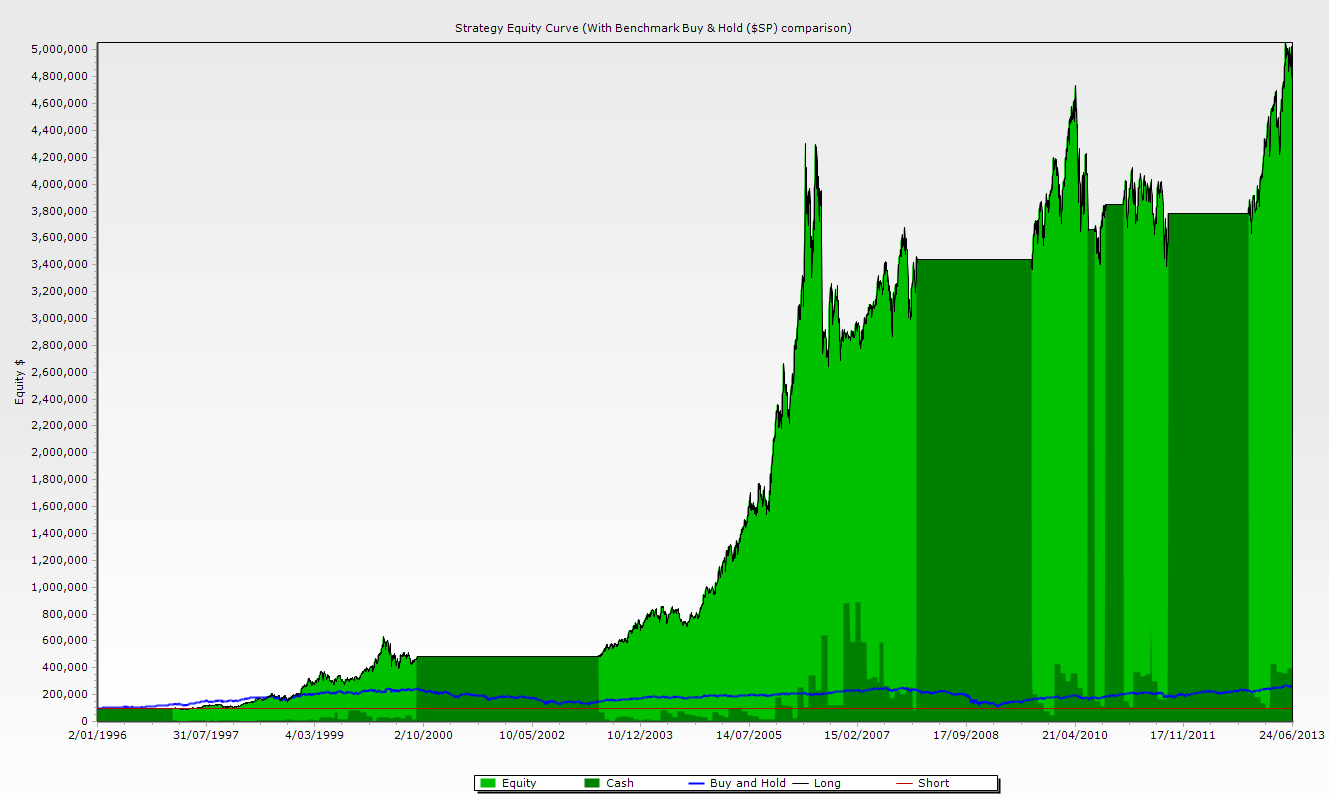
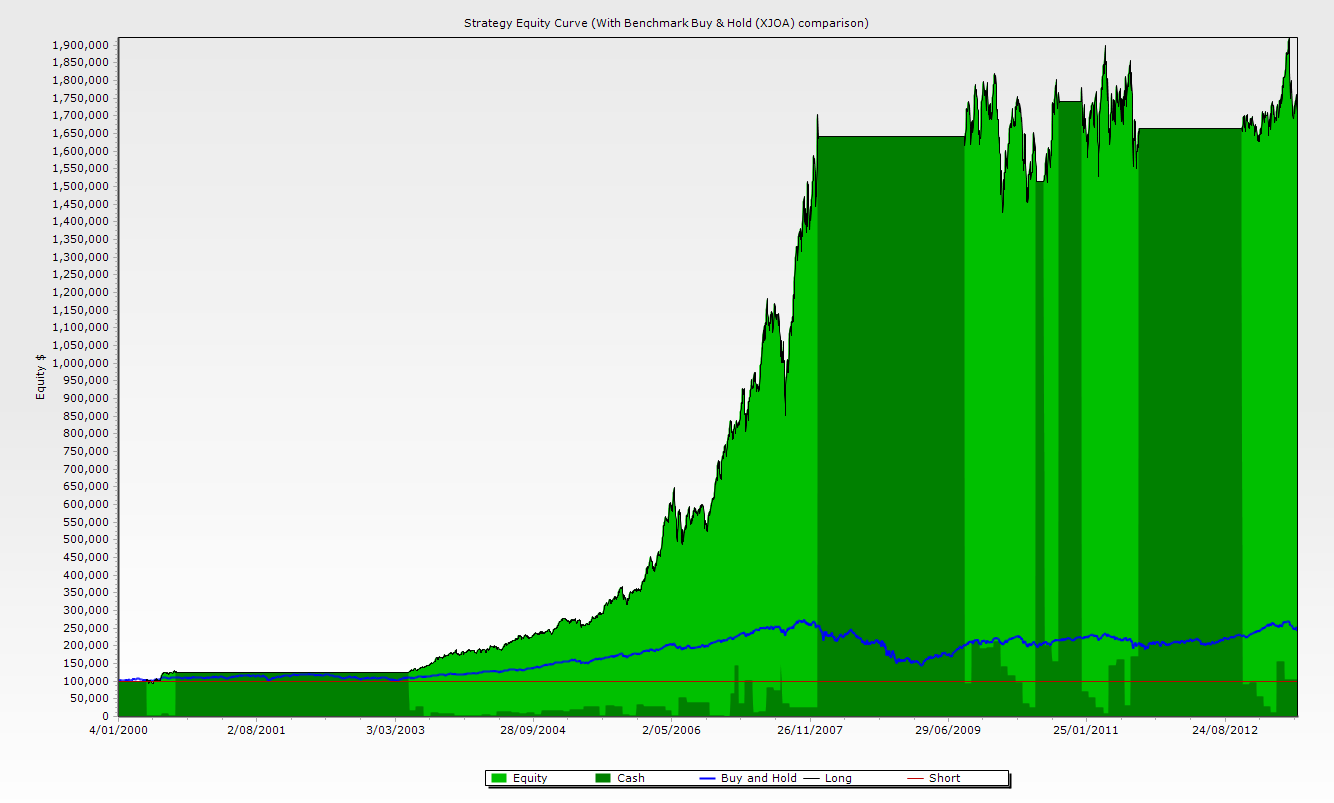
Twiggs Momentum is a specialized momentum indicator developed by me and used extensively in my Trading Diary market analysis. Below are the equity curves for historical simulations conducted on the S&P 500 and ASX 200. Further statistics are available at Research & Investment.
S&P 500
Historical simulation of $100,000 invested in S&P 500 stocks since January 1996 using our Twiggs Momentum strategy returned an average of 24.89% p.a. Dark green areas represent the move to cash when market risk is elevated. The blue line represents the benchmark S&P 500 index.

ASX 200
Historical simulation of $100,000 invested in ASX 200 stocks since January 2000 using Twiggs Momentum strategy returned an average of 23.77% p.a. Dark green areas represent the move to cash when market risk is elevated. The blue line represents the benchmark ASX 200 Accumulation Index.

Market Filters
It is difficult for equity strategies to produce positive results during market down-turns. We use macroeconomic and volatility filters to help preserve capital during sustained bear markets, moving to cash when risks are identified as elevated.
Investment Research & Systems
All strategies are developed and rigorously tested by Dr Bruce Vanstone and Colin Twiggs. Systems are rule-based to ensure decision-making is disciplined, unemotional and objective.
Key Features
| Investment Strategy: | S&P 500 | ASX 200 |
|---|---|---|
| Recommended Minimum Investment: | $50,000 USD | $50,000 AUD |
| Asset Classes: | S&P 500 stocks and cash | ASX 200 stocks and cash |
| Specific Exclusions: | No short sales. No derivatives | |
| Recommended Leverage: | None | None |
| Minimum Investment Timeframe: | 5 to 10 years | 5 to 10 years |
| Typical Number of Stocks: | 10 to 20 | 10 to 20 |
| Tax Implications: | Active strategies suitable for lower tax vehicles such as superannuation/pension funds. | |
| Diversification: | Effective strategy diversification through low correlation to fundamental equity strategies and major indices. | |
| Subscriber Limit: | 2500 subscribers | 500 subscribers |
Start Now
7 ways to find out more
- S&P500 Example Update
- ASX200 Example Update
- Statistics from Historical Simulations
- Past Performance
- Frequently Asked Questions
- Six good reasons not to subscribe to Research & Investment
- Contact us
A Word of Caution
I repeat my words from the last newsletter. Results that look too good to be true, normally are. No market filter can provide 100% protection against market down-turns, and simulations carried out on data history are no guarantee of future performance. Diversification, across asset classes, markets and strategies, is important to spread risk, but you must consider your risk profile. Please consult your financial adviser for advice tailored to your specific needs.
Quality is not an act, it is a habit.
~ Aristotle
Disclaimer
Research & Investment Pty Ltd is a Corporate Authorized Representative (AR Number 384 397) of Andika Pty Ltd which holds an Australian Financial Services Licence (AFSL 297069).
The information on this web site and in the newsletters is general in nature and does not consider your personal circumstances. Please contact your professional financial adviser for advice tailored to your needs.
Research & Investment Pty Ltd ("R&I") has made every effort to ensure the reliability of the views and recommendations expressed in the reports published on its websites and newsletters. Our research is based upon information known to us or which was obtained from sources which we believe to be reliable and accurate.
No guarantee as to the capital value of investments, nor future returns are made by R&I. Neither R&I nor its employees make any representation, warranty or guarantee that the information provided is complete, accurate, current or reliable.
You are under no obligation to use these services and should always compare financial services/products to find one which best meets your personal objectives, financial situation or needs.
To the extent permitted by law, R&I and its employees, agents and authorised representatives exclude all liability for any loss or damage (including indirect, special or consequential loss or damage) arising from the use of, or reliance on, any information. If the law prohibits the exclusion of such liability, such liability shall be limited, to the extent permitted by law, to the resupply of the said information or the cost of the said resupply.
Important Warning About Simulated Results
Research & Investment (R&I) specialise in developing, testing and researching investment strategies and systems. Within the R&I web site and newsletters, you will find information about investment strategies and their performance. It is important that you understand that results from R&I research are simulated and not actual results.
No representation is made that any investor will or is likely to achieve profits or losses similar to those shown.
Simulated performance results are generally prepared with the benefit of hindsight and do not involve financial risk. No modelling can completely account for the impact of financial risk in actual investment. Account size, brokerage and slippage may also diverge from simulated results. Numerous other factors related to the markets in general or to the implementation of any specific investment system cannot be fully accounted for in the preparation of simulated performance results and may adversely affect actual investment results.
To the extent permitted by law, R&I and its employees, agents and authorised representatives exclude all liability for any loss or damage (including indirect, special or consequential loss or damage) arising from the use of, or reliance on, any information offered by R&I whether or not caused by any negligent act or omission.

