Gold: Will it bounce?
By Colin Twiggs
April 18th, 2013 3:30 a.m. ET (5:30 p:m AET)
These extracts from my trading diary are for educational purposes. Any advice contained therein is provided for the general information of readers and does not have regard to any particular person's investment objectives, financial situation or needs and must not be construed as advice to buy, sell, hold or otherwise deal with any securities or other investments. Accordingly, no reader should act on the basis of any information contained therein without first having consulted a suitably qualified financial advisor. Full terms and conditions can be found at Terms of Use.
"Never try to catch a falling safe" warn the pundits..... "Wait for it to bounce."
So far we have not seen much bounce. After finding short-term support at $1320 on the 2-hourly chart, gold rallied to $1400 before retreating to test $1360. The long tail at $1360 indicates buying pressure and we should see another test of $1400. Breakout would indicate a rally to $1440*, but bear market rallies are notoriously unreliable and prudent traders are likely to avoid. Reversal below $1360 is likely and would warn of another down-swing.
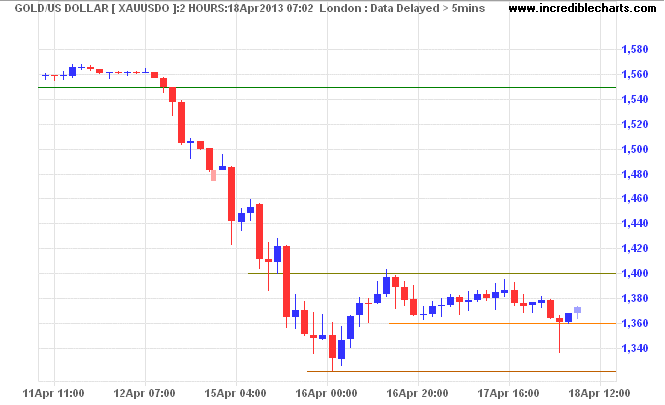
* Target calculation: 1400 + ( 1400 - 1360 ) = 1440
On the monthly chart we can see that $1300* is the obvious support level, but the severity of the fall indicates this is a bear market and will take time to recover. Breach of $1300 would signal another decline, with the next major support level at the 2008 high of $1000.
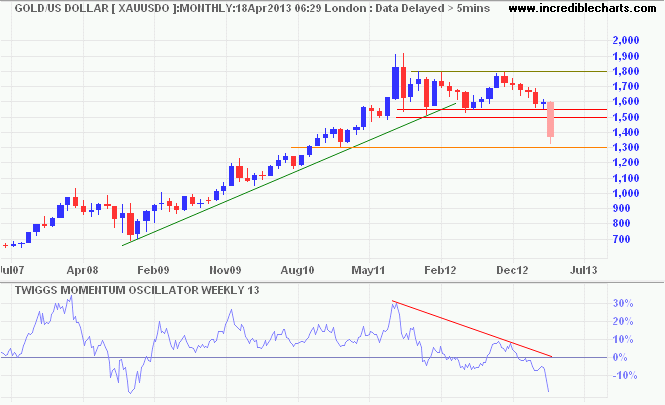
* Target calculation: 1550 - ( 1800 - 1550 ) = 1300
I remain bullish on gold in the long-term. We face a decade of easy monetary policy from central banks, with competing devaluations as each nation struggles to recover at the expense of the other. I recommend this WSJ interview with PIMCO CEO Mohamed El-Erian for his sober long-term assessment.
Dollar Index
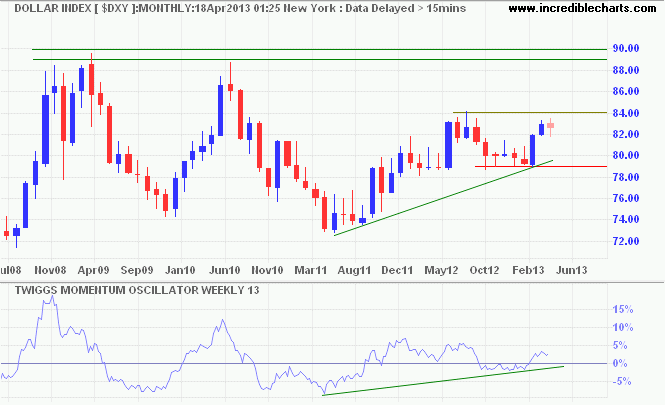
There has been no major strengthening of the Dollar, which one would expect if gold fell because of downward revision of the market's inflation outlook. Breakout above resistance at 84.00 would signal an advance to 89.00/90.00, but there is still much work to be done.
Crude Oil
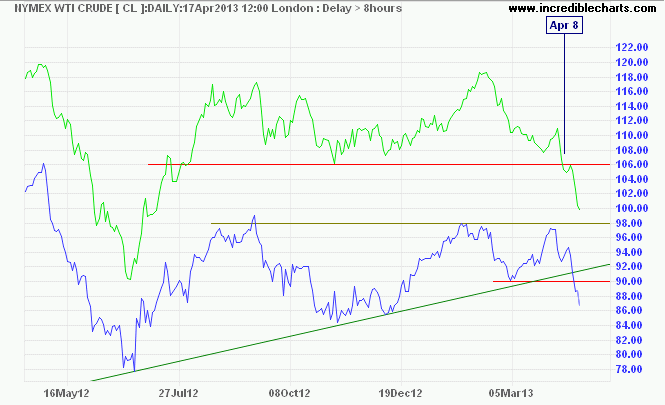
Crude oil prices fell sharply, signaling a primary down-trend. Interestingly, Brent Crude broke its primary support level at $106/barrel on April 8th, 4 days ahead of gold. Nymex WTI followed the next week and will soon be testing support at $84/barrel. Falling crude prices are a healthy long-term sign for the economy, but indicate medium-term weakness with weak demand anticipated in the year ahead.
Commodities
Dow Jones-UBS Commodity Index fell sharply in response to gold and oil. Divergence from the S&P 500 looks even more extreme and stock prices are likely to fall.
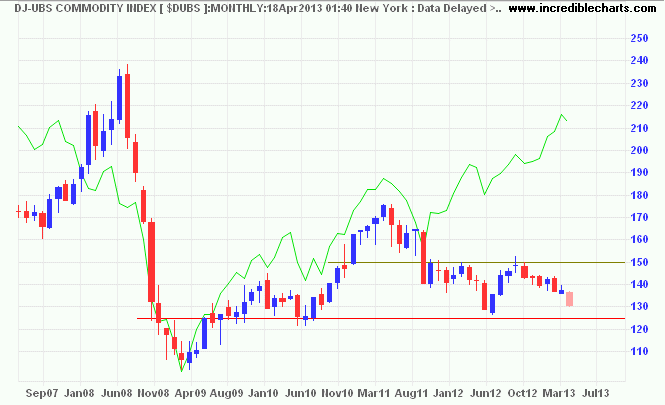
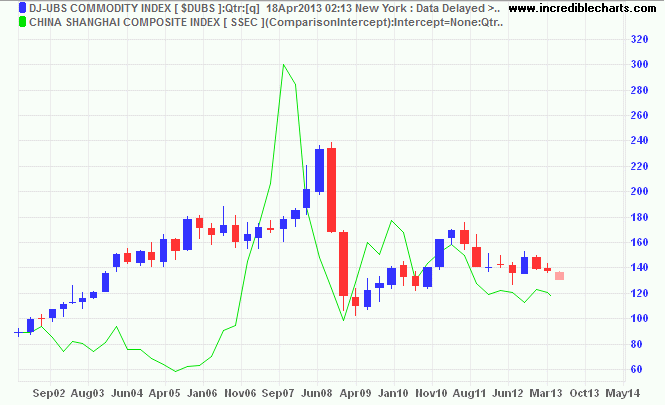
Slowing growth in China — the major driver of global commodity prices in recent years — is part of the problem, but aggressive action by Japan is also destabilizing global markets.
A country's wealth need not depend on natural resources, it may even ultimately benefit from their absence. The greatest resource of all is Man. What government has to do is to set the framework for human talent to flourish.
~ Margaret Thatcher, Statecraft: Strategies for a Changing World (2002)
