US: Falling momentum
By Colin Twiggs
December 4th, 2012 2:30 a.m. ET (6:30 p.m. AET)
These extracts from my trading diary are for educational purposes. Any advice contained therein is provided for the general information of readers and does not have regard to any particular person's investment objectives, financial situation or needs and must not be construed as advice to buy, sell, hold or otherwise deal with any securities or other investments. Accordingly, no reader should act on the basis of any information contained therein without first having consulted a suitably qualified financial advisor. Full terms and conditions can be found at Terms of Use.
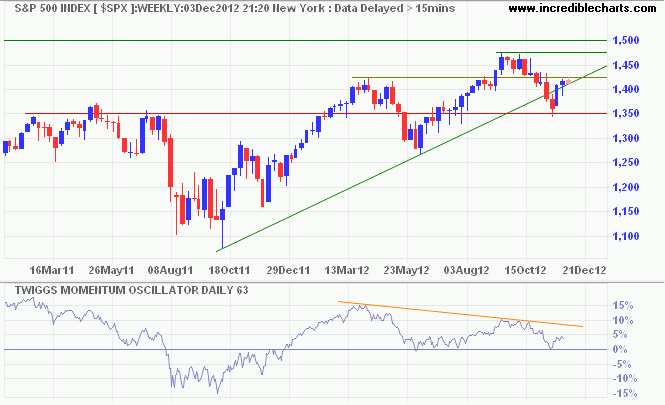
The S&P 500 weekly chart continues to warn of a primary down-trend, with bearish divergence on 63-day Twiggs Momentum. Reversal of TMO below zero would strengthen the signal. Hardening of positions in fiscal cliff negotiations makes another test of primary support at 1350 seem inevitable. Breakout above 1425 would test resistance at 1475, but declining momentum suggests advance above 1475 is unlikely.

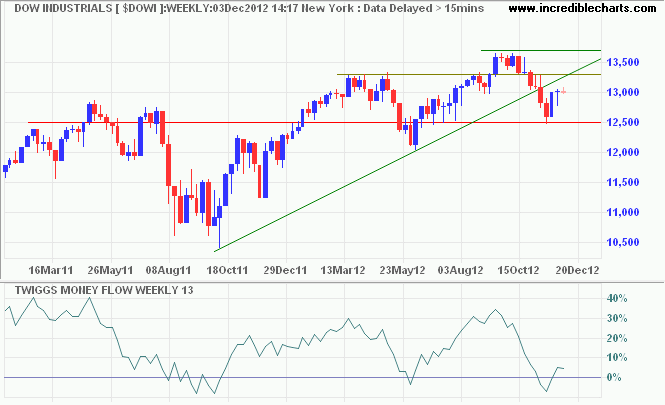
Dow Jones Industrial Average also indicates falling momentum, with breach of the rising trendline. Respect of resistance at 13300 would re-test primary support at 12500. Reversal of 13-week Twiggs Money Flow below zero would indicate rising selling pressure.

* Target calculation: 2400 - ( 2800 - 2400 ) = 2000
Ninety-eight percent of the adults in this country are decent, hard-working, honest Americans. It's the other lousy two percent that get all the publicity. But then — we elected them.
~ Lily Tomlin
