S&P 500 and Nasdaq test resistance
By Colin Twiggs
January 17th, 2012 2:00 a.m. ET (6:00 p.m. AET)
These extracts from my trading diary are for educational purposes and should not be interpreted as investment or trading advice. Full terms and conditions can be found at Terms of Use.
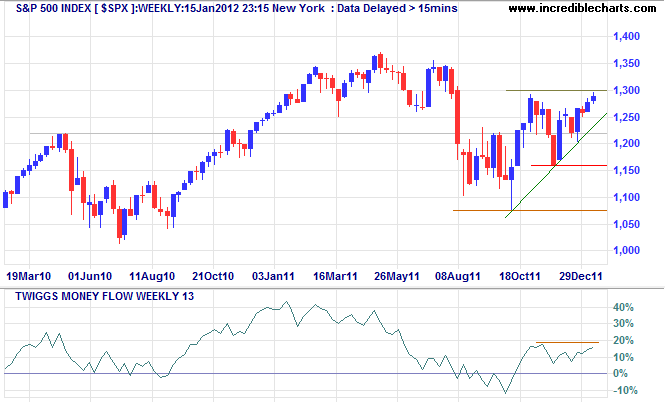
The S&P 500 index is testing resistance at 1300. Breakout would signal a primary up-trend with a target of 1450* for the initial advance. Mild bearish divergence on 13-week Twiggs Money Flow warns of selling pressure, however, and reversal below the rising trendline would indicate another test of primary support at 1160.

* Target calculations: 1300 + ( 1300 - 1150 ) = 1450
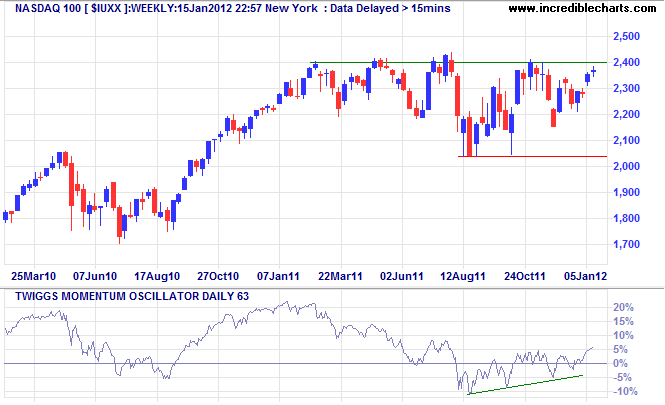
The Nasdaq 100 is also testing resistance, at 2400. Rising 63-day Twiggs Momentum and 13-week Twiggs Money Flow both suggest an upward breakout, which would offer a target of 2800* for the initial advance.

* Target calculations: 2400 + ( 2400 - 2000 ) = 2800
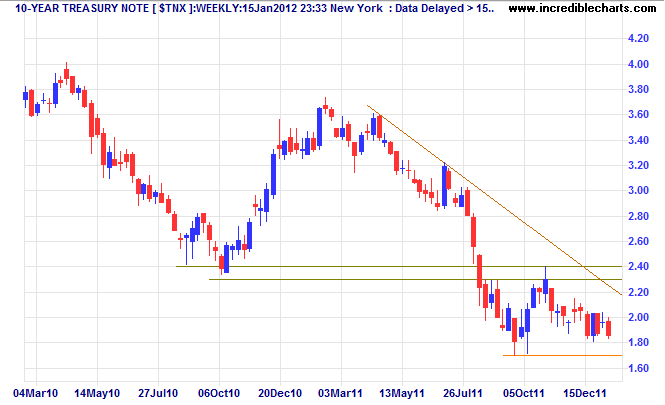
Treasury yields are falling, indicating a flight to safety. Uncertainty in Europe and China is likely to hurt the market and we should only accept bull signals if they have strong confirmation.

Ninety-eight percent of the adults in this country are decent, hard-working, honest Americans. It's the other lousy two percent that get all the publicity. But then — we elected them.
~ Lily Tomlin
