Now for the correction
By Colin Twiggs
October 31st, 2011 3:00 a.m. ET (6:00 p.m. AET)
These extracts from my trading diary are for educational purposes and should not be interpreted as investment or trading advice. Full terms and conditions can be found at Terms of Use.
Several weeks ago, when asked what it would take to reverse the bear market, I replied that it would take 3 strong blue candles on the weekly chart followed by a correction — of at least two red candles — that respects the earlier low. We have had three strong blue candles. Now for the correction.
On the S&P 500 expect retracement to test support at 1200 or 1250. Respect of 1250 would signal a strong up-trend, while failure of support at 1200 would warn of another test of primary support at 1100. A trough on 13-week Twiggs Money Flow that respects the zero line would also indicate strong buying pressure.
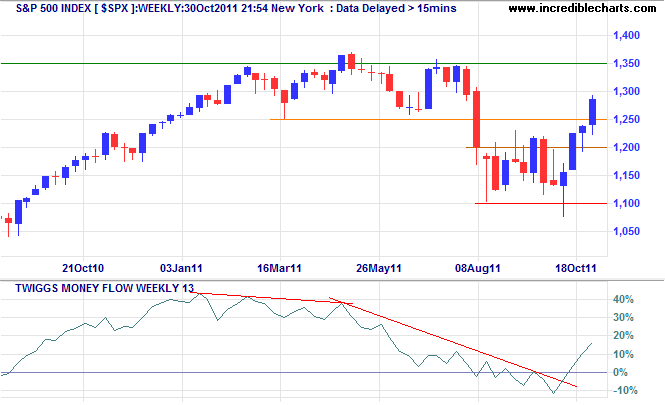
* Target calculation: 1225 + ( 1225 - 1100 ) = 1350
Dow Jones Industrial Average weekly chart displays a similar picture. Expect retracement to test support at 11500. A peak on 63-day Twiggs Momentum that respects the zero line would be bearish — warning of continuation of the primary down-trend.
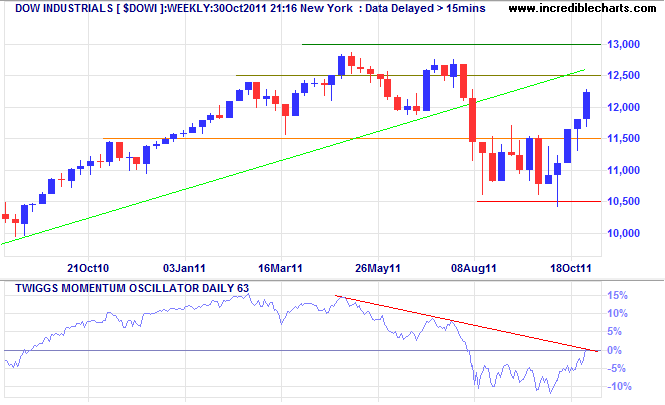
* Target calculation: 11500 + ( 11500 - 10500 ) = 12500
The Nasdaq 100 is testing resistance at 2400 — close to the 2011 high. Breakout would signal a primary advance to 2800*, while respect would warn of another test of primary support at 2000. Bullish divergence on 13-week Twiggs Money Flow has warned of a reversal for several weeks.
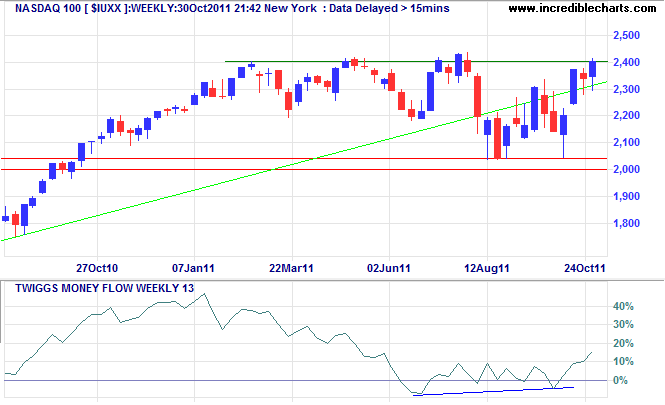
* Target calculation: 2400 + ( 2400 - 2000 ) = 2800
Europe rebounds
The FTSE 100 index is headed for a test of its 2011 high at 6000/6100. Rising 13-week Twiggs Money Flow signals strong buying pressure. Expect retracement to test support at 5400. Respect would confirm a primary up-trend; failure would re-test support at 4800.
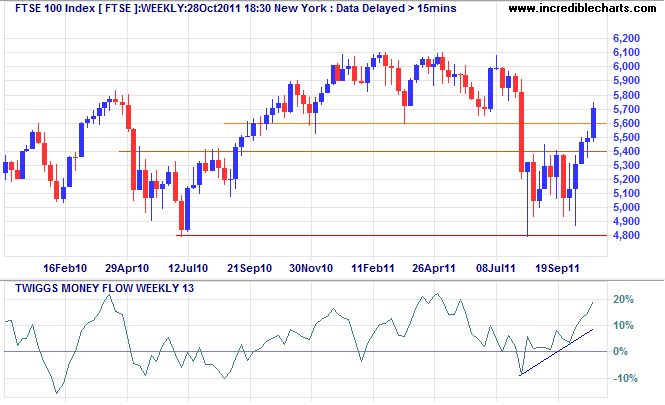
* Target calculation: 5400 + ( 5400 - 4800 ) = 6000
Germany's DAX is testing resistance at 6500. Retracement would test support at 5600. A 63-day Twiggs Momentum peak that respects the zero line would warn that the bear market will continue.
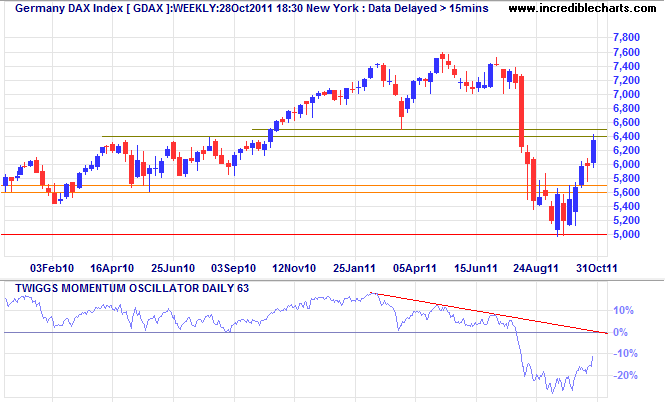
* Target calculation: 5700 + ( 5700 - 5000 ) = 6400
Italy is the latest canary in the coal mine. The FTSE MIB index rallied to test its secondary descending trendline at 17000. Respect would warn of another test of primary support at 13000, while breakout would offer a target of 19000*. The primary trend remains downward despite 13-week Twiggs Money Flow having crossed above zero.
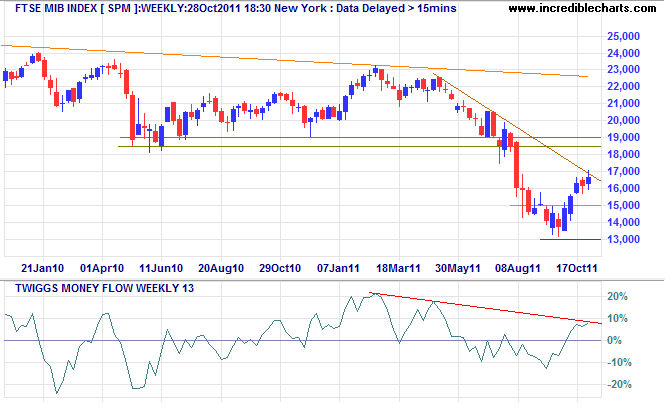
* Target calculation: 17 + ( 17 - 15 ) = 19
Canada TSX 60
Canada's TSX 60 index is headed for a test of resistance at 720/730 on the weekly chart. Expect a retracement. Respect of the trendline would warn of another test of primary support. Breakout above the descending trendline would signal that the primary down-trend has weakened and a bottom is forming. A 13-week Twiggs Money Flow trough that respects the zero line would indicate strong buying pressure.
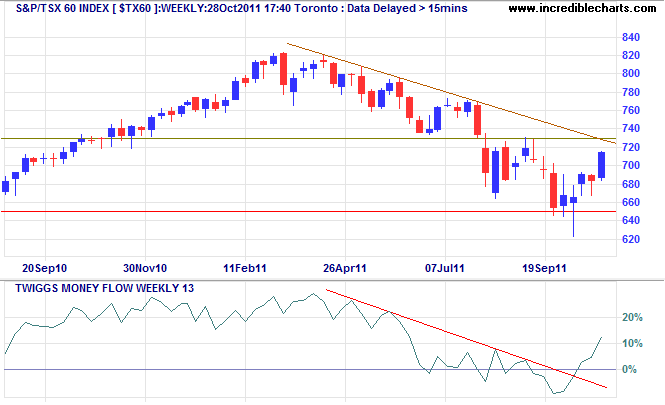
* Target calculation: 720 + ( 720 - 640 ) = 800
I never argue with the tape.
~ Jesse Livermore in Reminiscences of a Stock Operator by Edwin Lefevre.
