NASDAQ bullish divergence
By Colin Twiggs
October 10th, 2011 5:00 a.m. ET (8:00 p.m. AET)
These extracts from my trading diary are for educational purposes and should not be interpreted as investment or trading advice. Full terms and conditions can be found at Terms of Use.
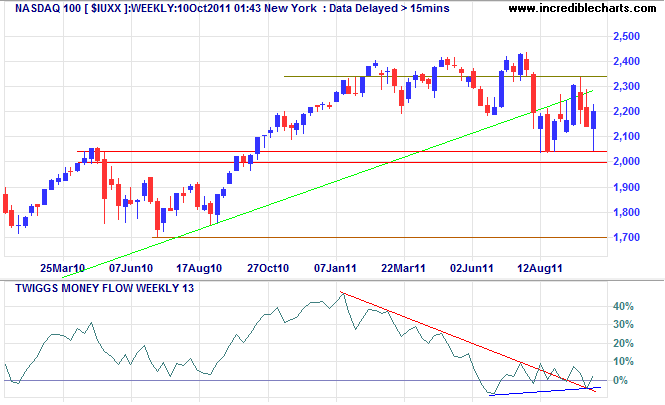
NASDAQ 100 index respected primary support at 2340 before rallying strongly on the weekly chart. Bullish divergence on 13-week Twiggs Money Flow indicates buying pressure. Breakout above 2340 would complete a double top. Reversal below 2000 is less likely, but would warn of a decline to 1700*. A word of caution: we are in a highly volatile market — do not act on signals without confirmation from other indexes.

* Target calculation: 2000 - ( 2300 - 2000 ) = 1700
One down five to go
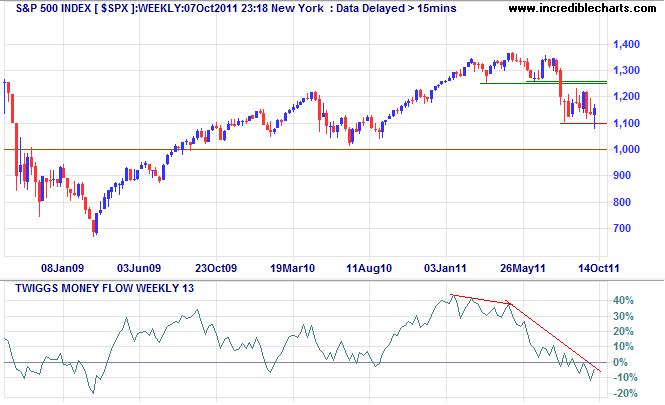
I say this rather flippantly as we are in the middle of a bear market, and I do not believe we are ready, but a reader asked what it would take to signal a bull market. My answer: three decent blue candles on the weekly chart followed by a correction of at least two red candles that respects the preceding low. The weekly chart of the S&P 500 index displays a blue candle with a long tail, signaling buying support. That would qualify as candle #1.

* Target calculation: 1100 - ( 1250 - 1100 ) = 950
There is no supporting divergence on 13-week Twiggs Money Flow to signal a change in the underlying selling pressure. Reversal to an up-trend is unlikely but would take a rally of at least 3 blue candles to break resistance at 1250 followed by a correction that finishes above 1100 — and re-crosses 1250. What is more likely is a failed attempt or false break at 1250 followed by penetration of support at 1100, signaling a decline to 1000/950*.
FTSE 100 buyers scarce
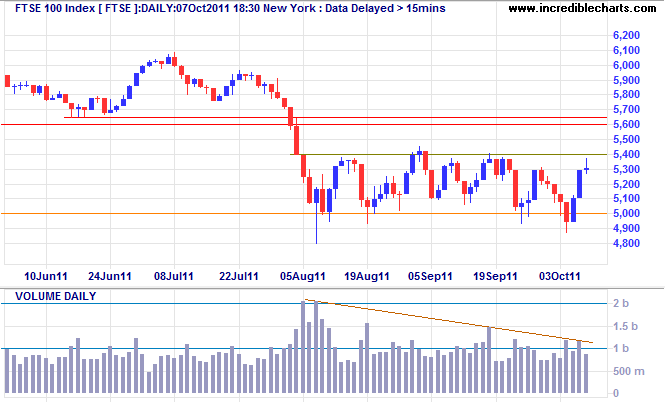
The FTSE 100 index encountered resistance at 5400. Low volume indicates that buyers were scarce and another test of support at 5000 is likely. We are in a primary down-trend and failure of support would signal a decline to 4400*.

* Target calculation: 5000 - ( 5600 - 5000 ) = 4400
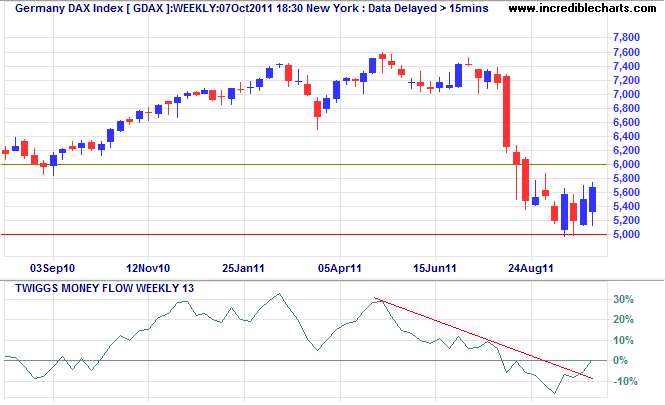
Germany's DAX is starting to rally on the weekly chart, with 13-week Twiggs Money Flow indicating medium-term buying pressure. Expect a test of 6000, but again we are in a primary down-trend, and another test of 5000 is likely. Failure of support would signal a decline to 4000*.

* Target calculation: 5000 - ( 6000 - 5000 ) = 4000
Successful traders always follow the line of least resistance. Follow the trend. The trend is your friend.
~ Jesse Livermore in Reminiscences of a Stock Operator by Edwin Lefevre.
