Selling pressure continues
By Colin Twiggs
May 9th, 2011 6:00 a.m. ET (8:00 p.m. AET)
These extracts from my trading diary are for educational purposes and should not be interpreted as investment or trading advice. Full terms and conditions can be found at Terms of Use.
Selling pressure continues to dominate across major markets with the exception of the EU (DAX and CAC-40). The only optimistic note is rising international shipping rates and US transport stocks, reflecting an up-turn in economic activity.
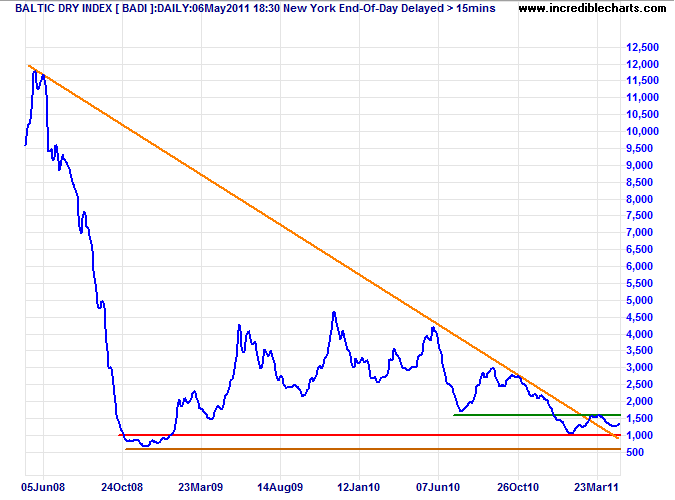
The Baltic Dry Index broke its declining trendline, warning that the long down-trend is ending. Recovery above 1600 would confirm. This would be a positive sign, especially for resources stocks. Over-supply of Cape-size vessels depressed shipping rates despite reduced cruising speeds to conserve fuel (longer voyage times reduce the over-supply). And recent flooding in Queensland Australia slowed coal shipments, placing further downward pressure on rates. Rising rates should therefore indicate robust demand for commodities, particularly iron ore and coal.
USA
Dow Jones Industrial Average
The Dow is testing medium-term support between 12400 and 12500; breakout would signal a correction. The tall shadow on Friday's candle and bearish divergence on 21-day Twiggs Money Flow both warn of selling pressure. Recovery above 12900 is unlikely but would indicate an advance to 13200*.
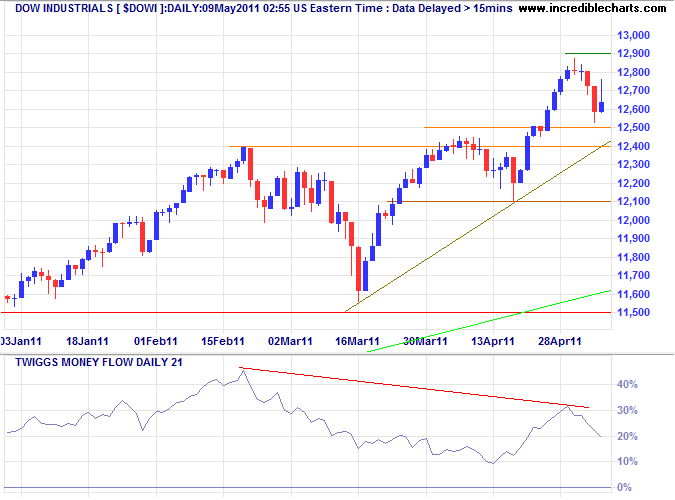
* Target calculation: 12400 + ( 12400 - 11600 ) = 13200
S&P 500
The S&P 500 reversed below 1300, indicating a correction. Breach of the rising trendline would warn that the up-trend is ending. Bearish divergence on 21-day Twiggs Money Flow signals selling pressure. Recovery above 1350 is unlikely, but would indicate an advance to 1450*.
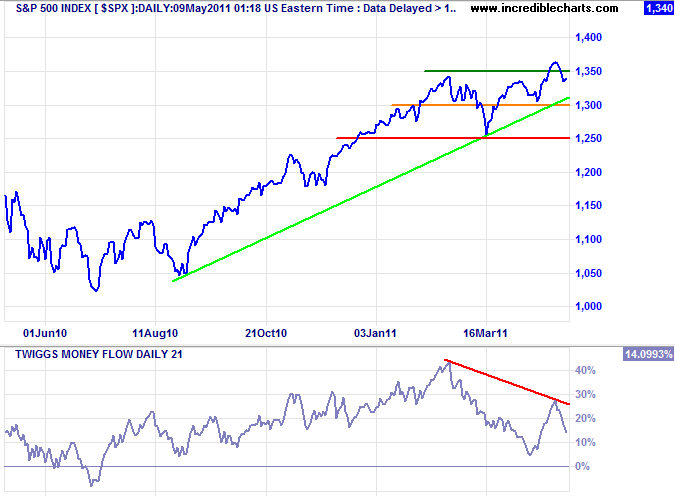
* Target calculation: 1350 + ( 1350 - 1250 ) = 1450
Transport
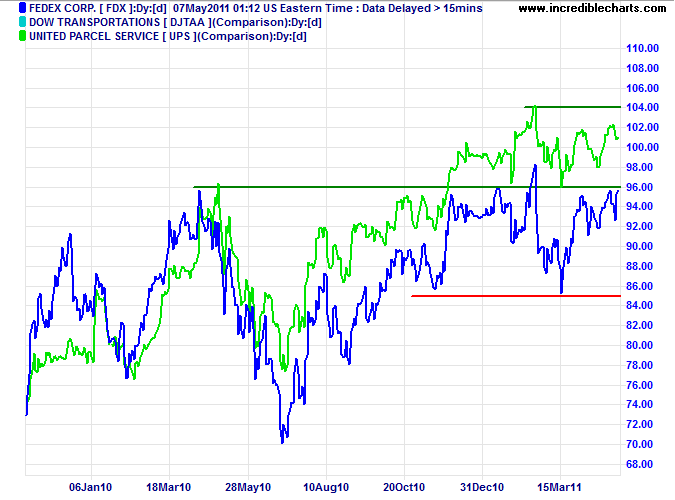
Bellwether stock Fedex is testing resistance at 96. Breakout is likely, given the short retracements, and would signal another primary advance. UPS breakout above its February high would confirm the advance — a positive sign for the economy.
Technology
The Nasdaq 100 retreated below support at 2400; a bearish sign. Divergence on 13-week Twiggs Money Flow also warns of selling pressure. Failure of support at 2350 would test primary support at 2200. Recovery above 2400 is unlikely, but would indicate an advance to 2600*.
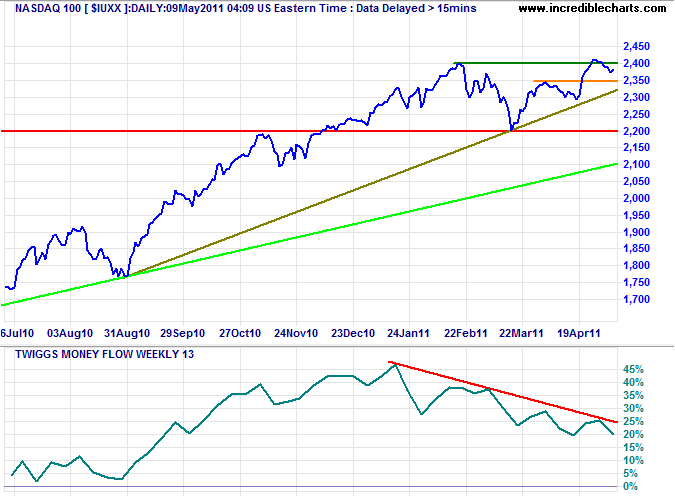
* Target calculation: 2400 + ( 2400 - 2200 ) = 2600
Canada: TSX
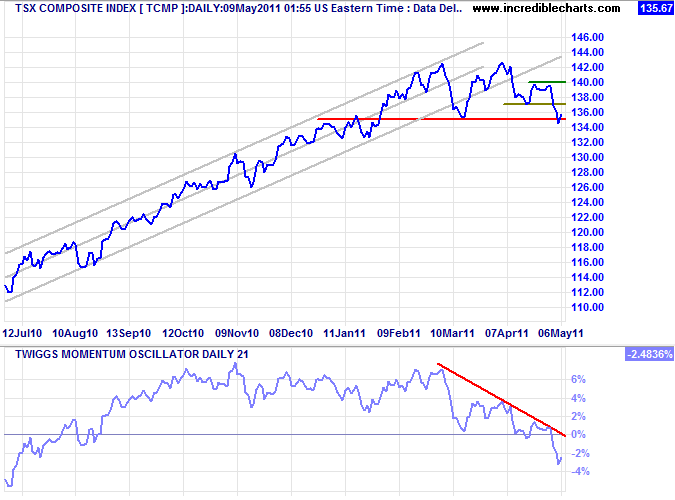
TSX Composite Index dipped below primary support at 13500 before recovering. Reversal below 13500 would confirm the primary down-trend. Twiggs Momentum below zero warns that the up-trend has ended; a peak that respects the zero line would confirm the down-trend.
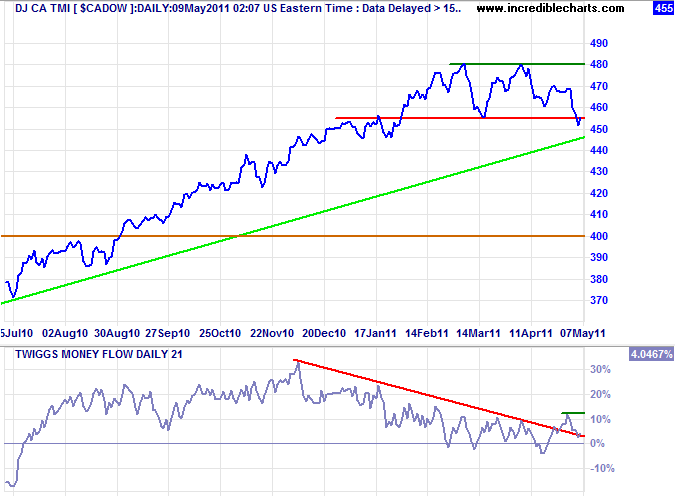
The $CADOW displays a similar pattern. Breakout above the descending trendline on 21-day Twiggs Money Flow suggests short/medium-term buying support. Respect of the zero line would signal a bear trap.
United Kingdom
The FTSE 100 is testing support at 5860; failure would warn of correction to primary support at 5600. Twiggs Money Flow (21-day) below zero indicates selling pressure; a peak below the zero line would warn of a down-trend.
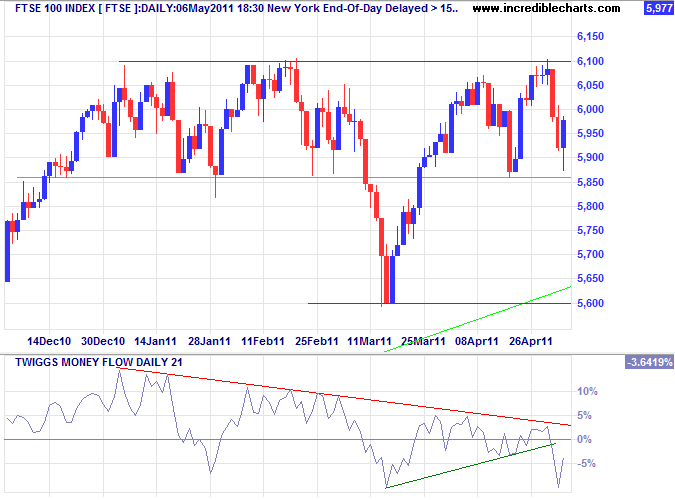
* Target calculation: 6100 + ( 6100 - 5600 ) = 6600
Germany
The DAX dipped below support at 7450; recovery above 7600 would confirm a bear trap and primary advance, while failure of short-term support at 7300 (and the rising trendline) would warn of a correction. Rising 21-day Twiggs Money Flow favors an advance.
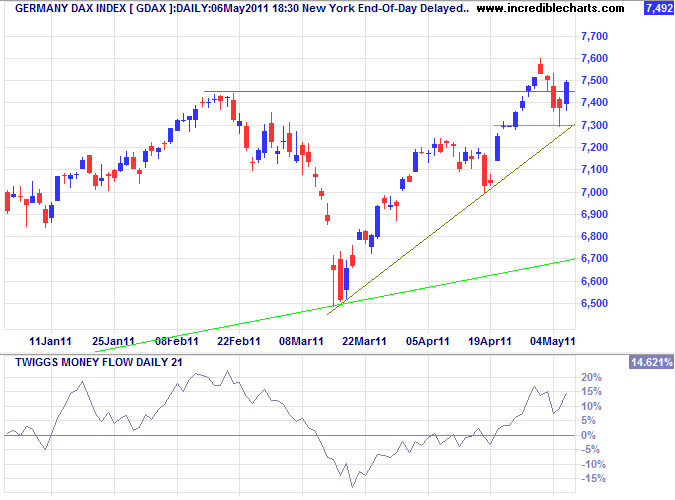
* Target calculation: 7500 + ( 7500 - 6500 ) = 8500
France
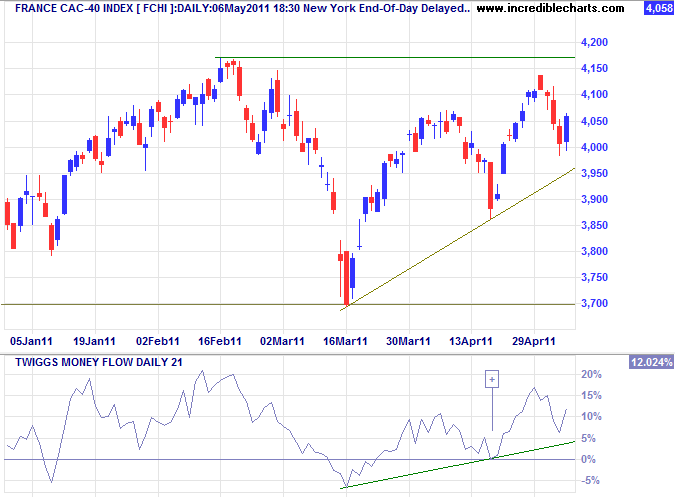
The CAC-40 is headed for a test of resistance at 4170. Breakout would signal a primary advance, while reversal below the rising trendline would warn of a correction. Twiggs Money Flow (21-day) respecting the zero line [+] indicates buying pressure.
India
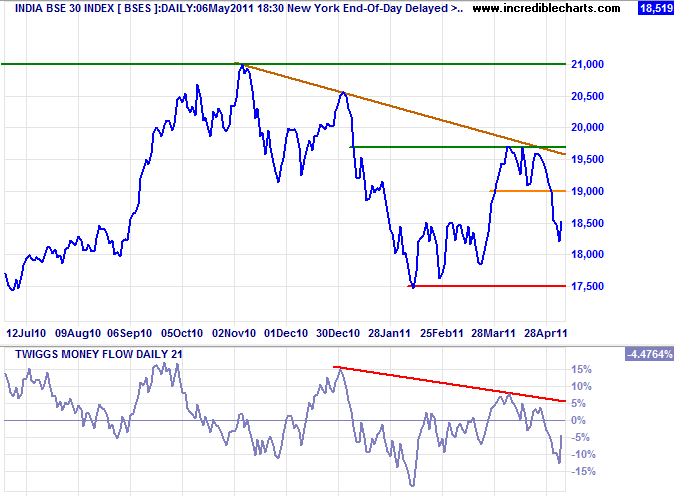
The Sensex is retracing to find short-term resistance, but Twiggs Money Flow (21-day) below zero indicates selling pressure. Expect another test of primary support at 17500.
Singapore
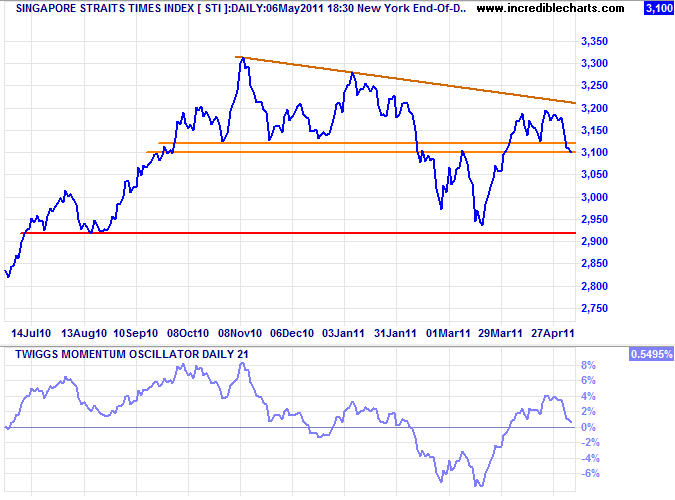
The Straits Times Index recovered to 3140 Monday but remains in a primary down-trend. Failure of support at 3100 would suggest another test of primary support at 2920.
Japan
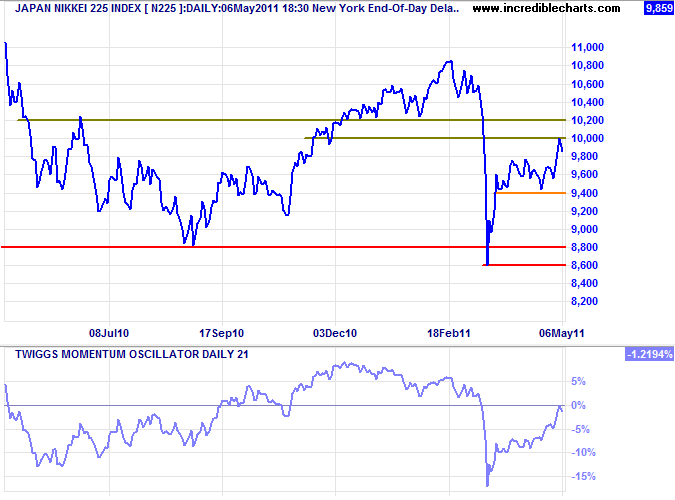
The Nikkei 225 respected resistance at 10000 on Monday. Reversal below 9400 would warn of another test of primary support at 8600. The primary trend remains down and intervention by the BOJ is unlikely to change this.
South Korea
The Seoul Composite Index broke its secondary trendline to warn of a correction. Failure of support around 2100 would indicate a test of support at 2000 and the primary trendline. Bearish divergence on 13-week Twiggs Money Flow warns of a reversal.
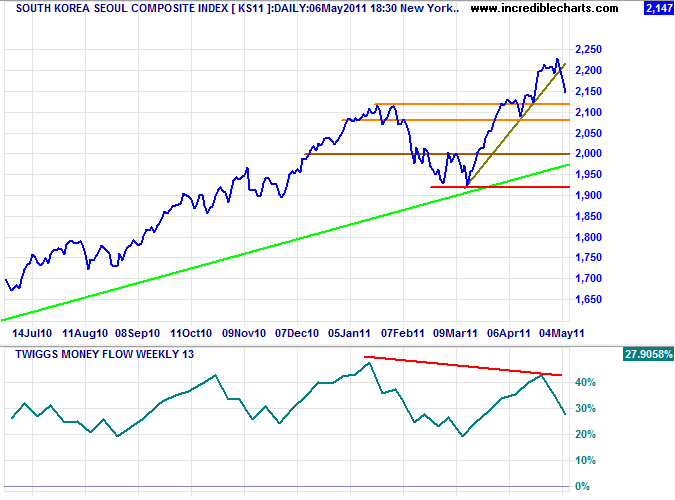
* Target calculation: 2100 + ( 2100 - 1950 ) = 2250
Taiwan
The Dow Jones Taiwan Index broke medium-term resistance at 212, indicating a test of the January high at 220. Rising 21-day Twiggs Money Flow indicates buying pressure. Breach of the rising trendline is now unlikely, but would warn of another test of primary support at 196.
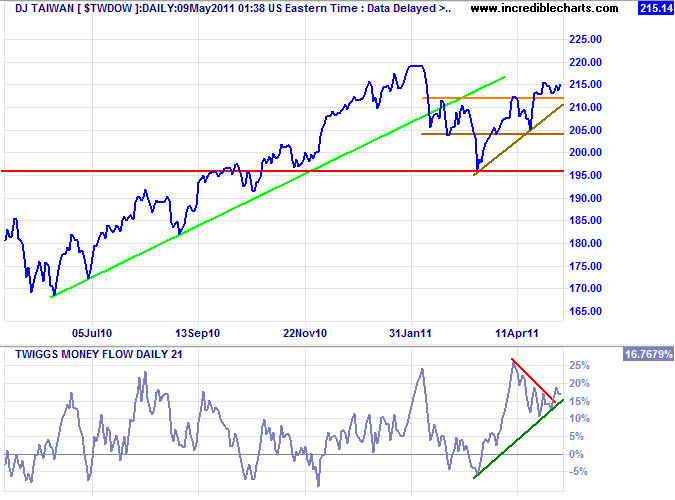
* Target calculation: 220 + ( 220 - 195 ) = 245
China
The Shanghai Composite Index continues to test support between 2850 and 2900 on Monday. Failure would test primary support at 2650. Bearish divergence on 21-day Twiggs Money Flow indicates selling pressure.
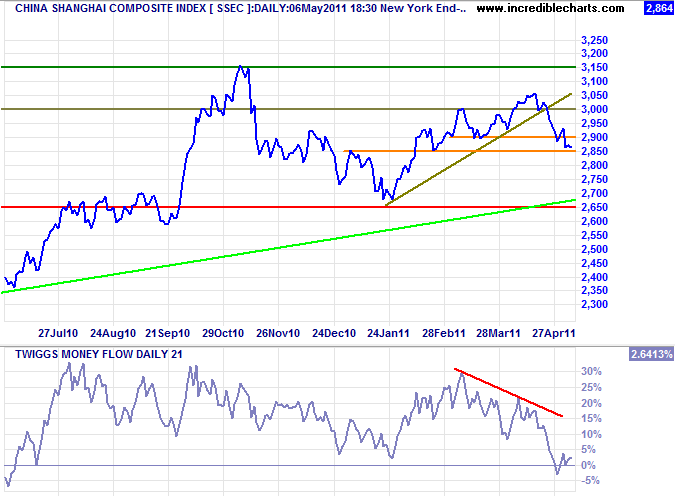
* Target calculations: 3100 + ( 3100 - 2700 ) = 3500
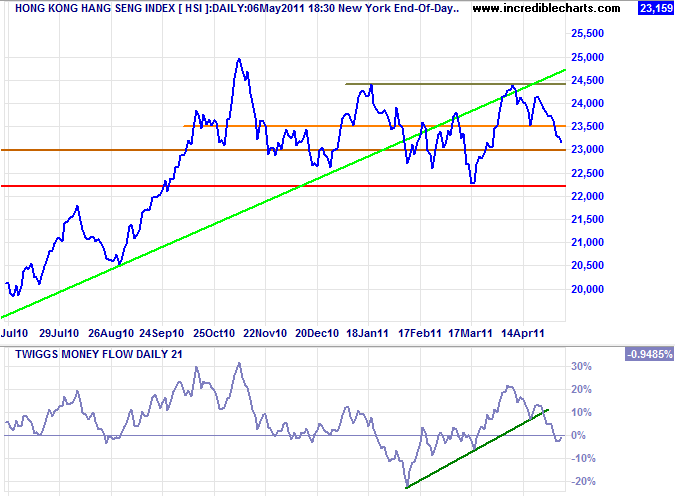
The Hang Seng Index is undergoing another correction after breaking support at 23500. Failure of the long-term trendline has already indicated that the up-trend is over. Reversal of 21-day Twiggs Money Flow below zero reflects selling pressure. Breach of 23000 would test primary support at 22200 — and failure of that level would signal a primary down-trend.
Brazil: Bovespa
The Bovespa Index recovered above primary support at 64000, but both primary and secondary trends remain down. Reversal below 64000 would confirm another decline with a target of 58000*.
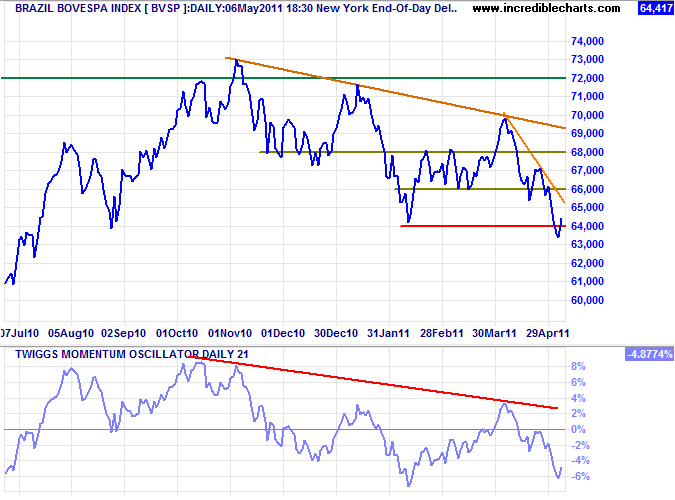
* Target calculation: 64000 - ( 70000 - 64000 ) = 58000
South Africa: JSE
The JSE Overall Index continues to display long-term bearish divergence on 21-day Twiggs Money Flow, warning of selling pressure. Breach of support at 31400 would indicate a correction to primary support at 30000. Twiggs Money Flow reversal below zero would confirm. Recovery above 33000 remains unlikely, but would signal an advance to 36000*.
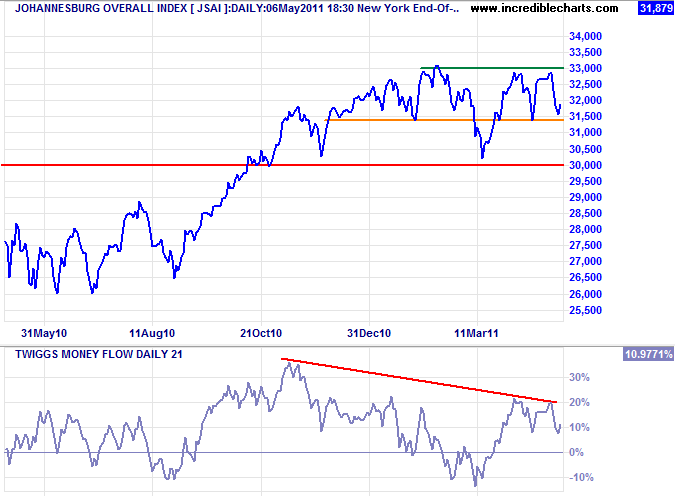
* Target calculation: 33000 + ( 33000 - 30000 ) = 36000
New Zealand: NZX
The NZX50 is testing resistance at 3500*. Rising 13-week Twiggs Money Flow indicates buying pressure. Breach of the secondary trendline, however, would warn of a correction; while failure of short-term support at 3425 would confirm.
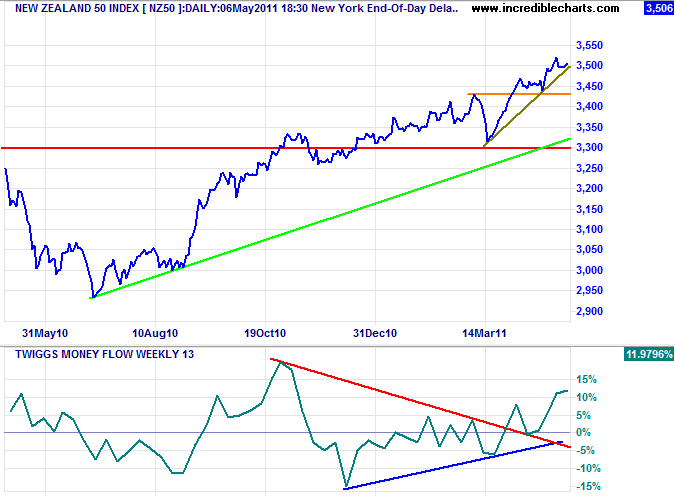
* Target calculation: 3425 + ( 3425 - 3300 ) = 3550
Australia: ASX
The All Ordinaries is undergoing a correction. Today's tall shadow and declining 21-day Twiggs Money Flow indicate selling pressure. Failure of support at 4800 would test primary support at 4560. Recovery above 4870, however, would suggest that the correction is weakening.
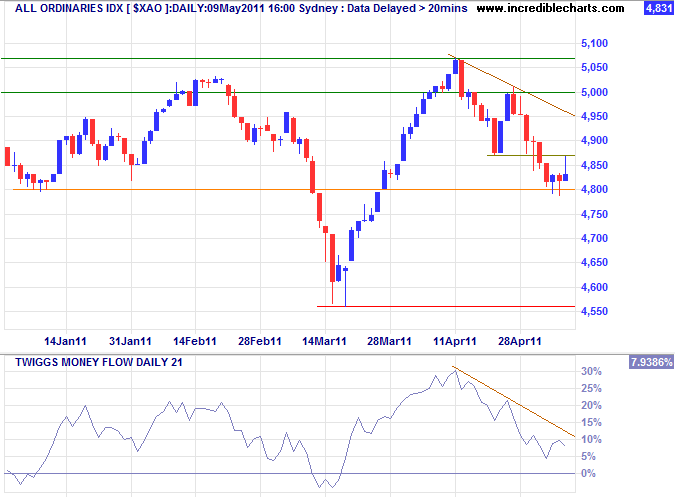
* Target calculation: 5000 + ( 5000 - 4600 ) = 5400
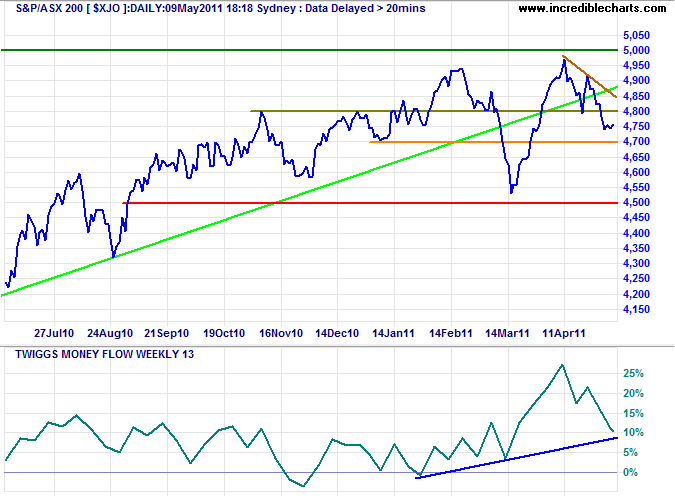
An ASX 200 breach of support at 4700 would also signal a test of primary support. The sharp fall on 13-week Twiggs Money Flow (13-week) indicates selling pressure. But we are still a long way from a breach of 4500 which would signal a primary down-trend.
The fundamental cause of today's emerging problems was excessive and imprudent credit growth over a long period. Policy interest rates in the advanced industrial countries have been unusually low. Should governments feel it necessary to take direct actions to alleviate debt burdens, it is crucial that they understand one thing beforehand. If asset prices are unrealistically high, they must fall. If savings rates are unrealistically low, they must rise. If debts cannot be serviced, they must be written off. To deny this through the use of gimmicks and palliatives will only make things worse in the end.
~
former BIS chief economist William White (2010)
