Dow Hesitates At 10,000
By Colin Twiggs
October 19, 2:00 a.m. ET (5:00 p.m. AET)
These extracts from my trading diary are for educational purposes and should not be interpreted as investment or trading advice. Full terms and conditions can be found at Terms of Use.
We are near the end of the high-risk period following the third quarter. The Dow penetrated resistance at 10000, but is retracing to test the new support level. Respect of support would confirm a bull market, while reversal below 10000 would warn of a secondary correction.
In the long run, we are not out of the woods. The global financial system remains on life support. Housing foreclosures and bank failures continue at abnormal levels. The US government plans to run budget deficits of 40 per cent or more in 2009 and 2010 in an attempt to stimulate the economy. They are unlikely to recover without suffering hyper-inflation; which would boost dollar prices of stocks, precious metals and real estate, but cause further long-term damage to the economy.
Commodities
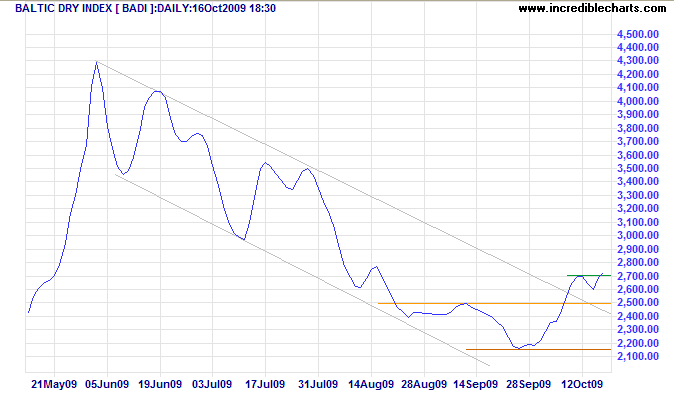
The Baltic Dry Index, after a brief retracement, broke through short-term resistance at 2700, confirming that the secondary correction is over. Demand for bulk commodity shipping is recovering — a positive sign for commodity prices and resources stocks.
The RJ/CRB Commodities Index broke through resistance at 270, signaling a primary advance to 300/310* — a positive sign for energy and resources stocks. Reversal below 247 is now unlikely, but would warn of a primary down-trend.
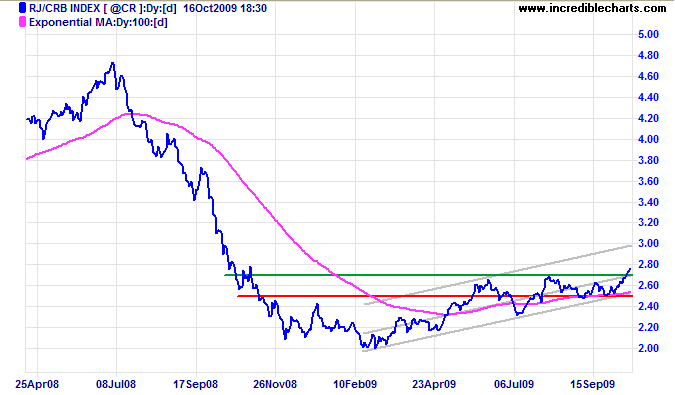
* Target calculation: 270 + ( 270 - 230 ) = 310
USA
Dow Jones Industrial Average
The Dow is retracing to test the new support level at 10000 after breaking out earlier in the week. Failure of support would warn of a secondary correction — confirmed if support at 9500 is penetrated. Recovery above 10100, however, would signal another primary advance. Bearish divergence on Twiggs Money Flow (21-day) favors a correction. In the long term, breakout above 10000 would offer a target of 12000*; reversal below support at 8000 is unlikely, but would warn of a primary down-trend.
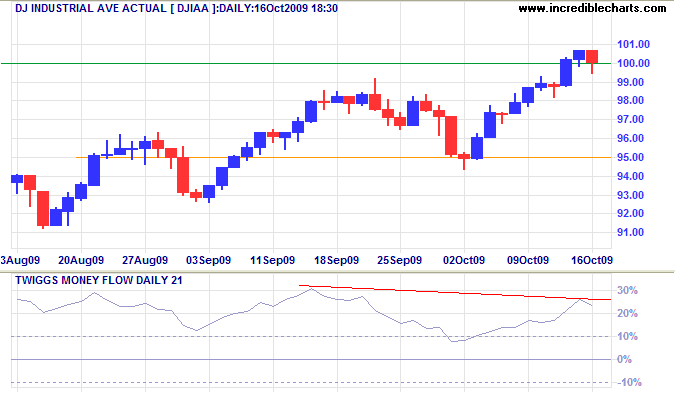
* Target calculation: 10000 + ( 10000 - 8000 ) = 12000
S&P 500
The S&P 500 is testing resistance at 1100. Bearish divergence on Twiggs Money Flow (13-week), however, favors a correction. Reversal below support at 1020 would confirm. In the long-term, breakout above 1100 would signal a rally to test the upper channel around 1200*; failure of support at 900 is unlikely, but would warn of a primary down-trend.
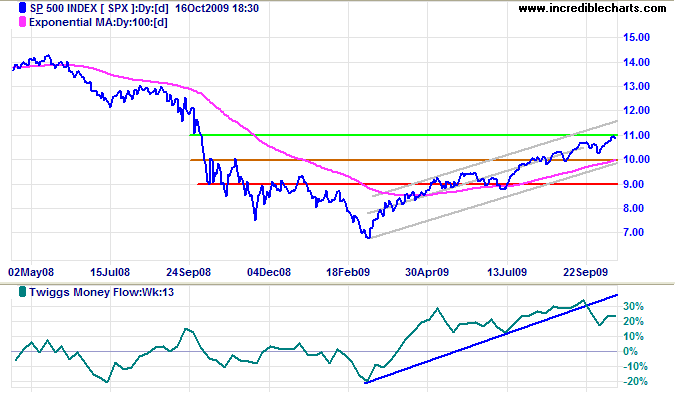
* Target calculation: 1100 + ( 1100 - 1000 ) = 1200
Transport
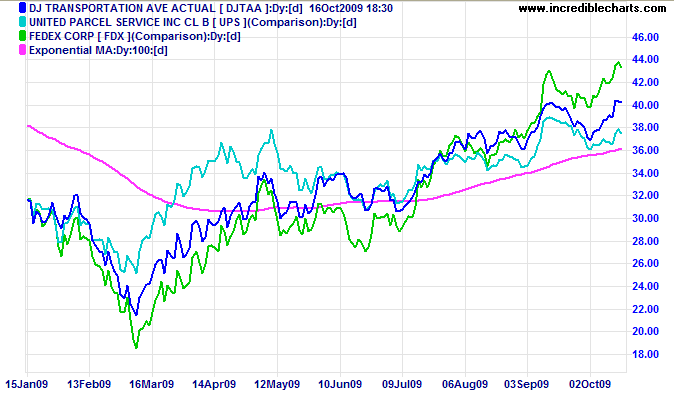
The Dow Transport Average, UPS and Fedex remain in a primary up-trend — a positive sign for the economy.
Technology
The Nasdaq 100 encountered short-term resistance at 1750. Reversal below support at 1650 would warn of a secondary correction, while recovery above 1750 would signal a primary advance with a target of 1900*. Bearish divergence on Twiggs Money Flow (21-day) favors a correction.
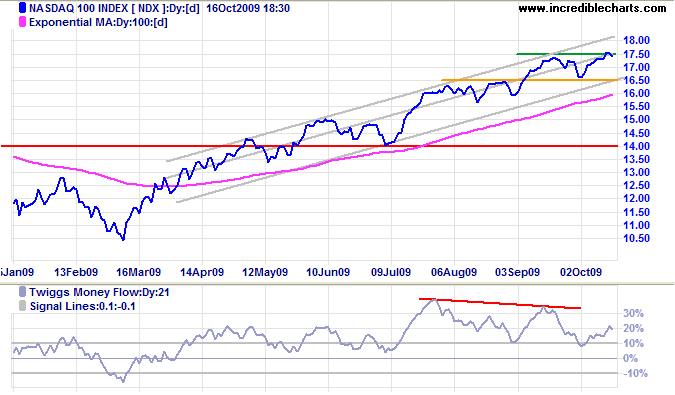
* Target calculation: 1700 + ( 1600 - 1400 ) = 1900
Canada: TSX
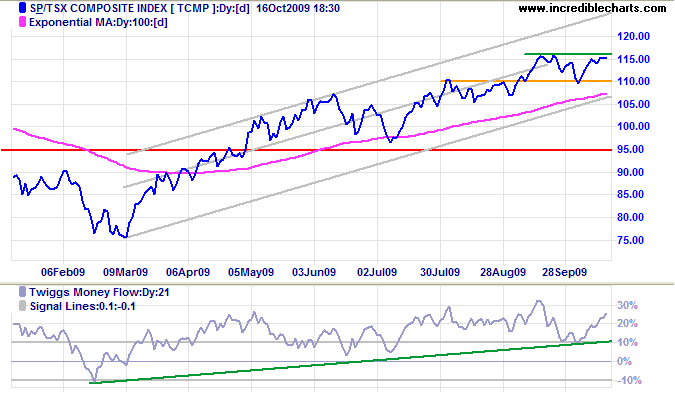
The TSX Composite is consolidating in a narrow band below resistance at 11600: a bullish sign. Breakout above 11600 would signal another primary advance, while reversal below 10900/11000 would confirm a secondary correction. Twiggs Money Flow (21-day) holding well above the zero line indicates long-term buying pressure, favoring a further advance.
United Kingdom: FTSE
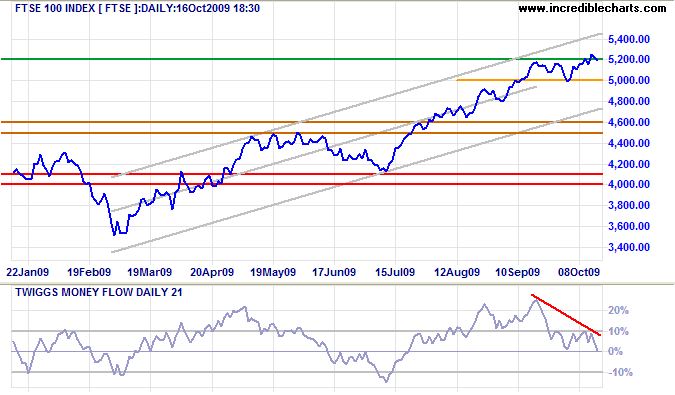
The FTSE 100 is testing the new support level at 5200. Bearish divergence on Twiggs Money Flow (21-day) warns of a secondary correction. Failure of support at 5000 would confirm.
Germany: DAX
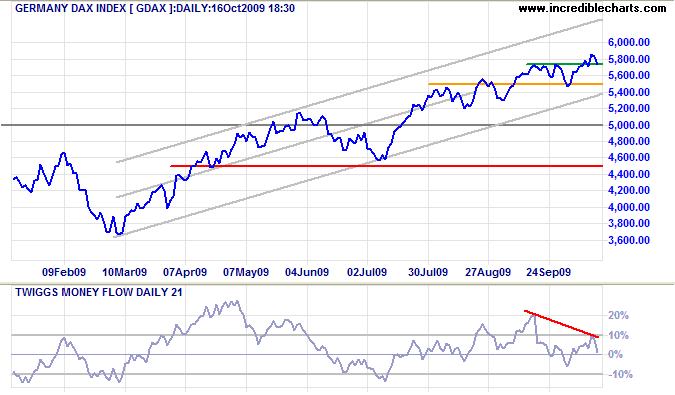
The DAX also displays a bearish divergence on Twiggs Money Flow (21-day). Failure of support at 5500 would confirm a secondary correction.
India: Sensex
The Sensex is advancing to test resistance at 17500. Twiggs Money Flow (13-week) holding well above the zero line indicates buying pressure. Breakout above 17500 would offer a target of 20000*. Failure of short-term support at 16500, however, would indicate a secondary correction.
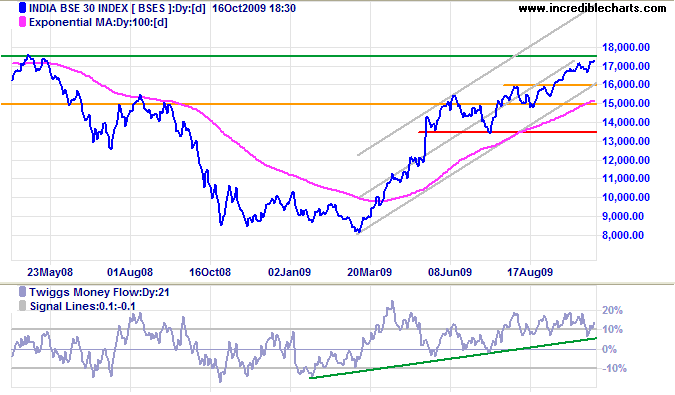
* Target calculation: 17500 + ( 17500 - 15000 ) = 20000
Japan: Nikkei
The Nikkei 225 recovered above 10000, but bearish divergence on Twiggs Money Flow (13-week) warns of selling pressure. Reversal below 9600 would signal a primary down-trend. Breakout above 10600 is unlikely, but would suggest a target of 11600*.
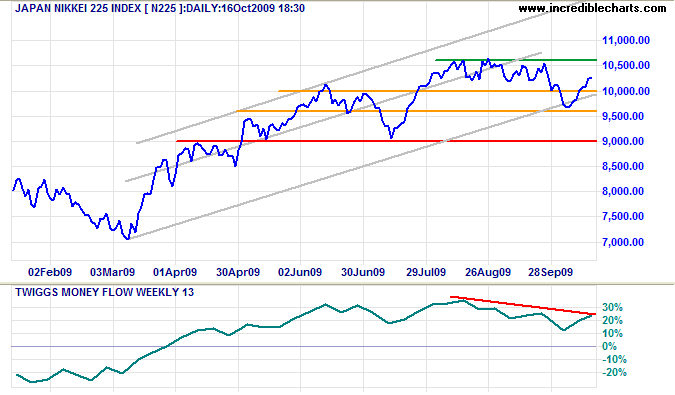
* Target calculation: 10600 + ( 10600 - 9600 ) = 11600
South Korea
The Seoul Composite is also undergoing a secondary correction. Twiggs Money Flow (21-day) bearish divergence confirms. Failure of support at 1600 would offer a target of 1500* — at the lower trend channel.
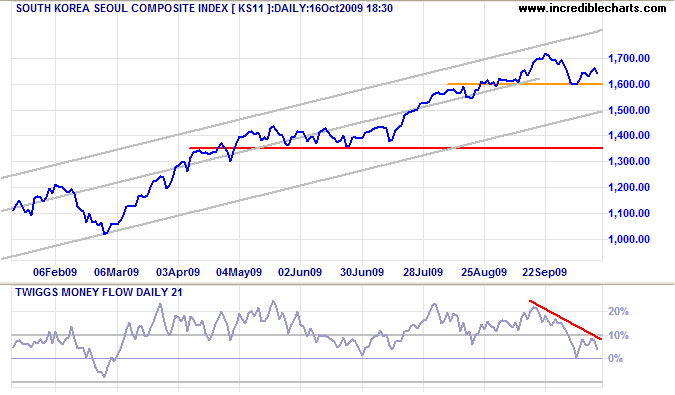
* Target calculation: 1600 - ( 1700 - 1600 ) = 1500
China
The Shanghai Composite Index encountered resistance at 3000, but Monday opening has seen a breakout. Follow-through above 3050 would signal the start of a new primary advance, while reversal below 3000 would indicate weakness. Twiggs Money Flow (21-day) bearish divergence warns of continued selling pressure. In the long term, a primary advance would offer a target of 4300*, while failure of support at 2650 would signal a primary down-trend.
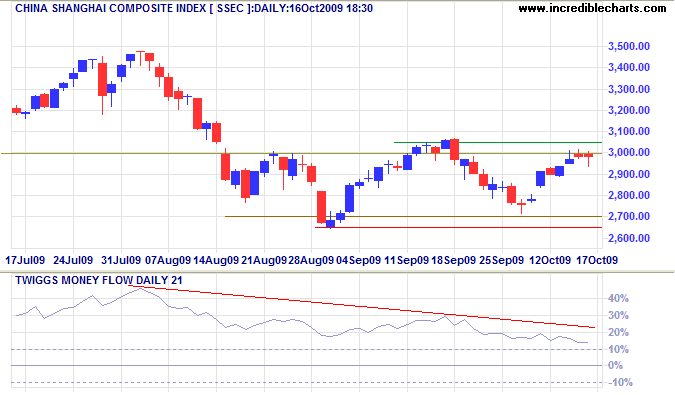
* Target calculations: 3500 + ( 3500 - 2700 ) = 4300
The Hang Seng Index made a false break [F] through resistance at 22000, indicating weakness. Bearish divergence on Twiggs Money Flow (21-day) warns of a correction. Failure of support at 20000 would warn of a primary down-trend, confirmed if 19500 is penetrated. In the long term, breakout above 22000 would offer a target of 23500*.
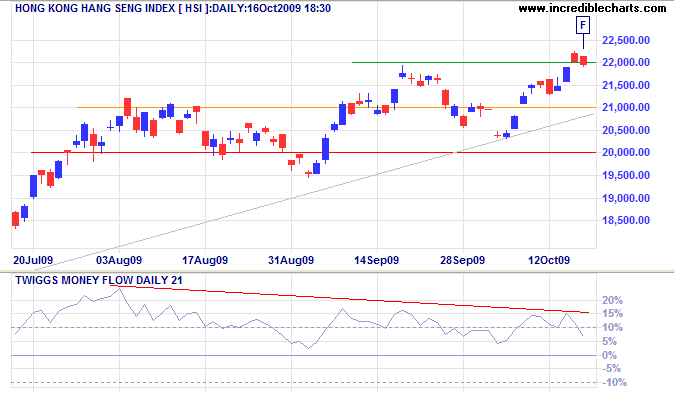
* Target calculation: 22000 + ( 22000 - 20500 ) = 23500
Australia: ASX
The All Ordinaries is retracing to test the new short-term support level at 4800. Reversal below 4750 would warn of a secondary correction. Bearish divergence on Twiggs Money Flow (21-day) also warns of a correction. Breakout above 4900, however, would test the key resistance level of 5000*. In the long term, breakout above 5000 would offer a target of 6000*; failure of support at 3700 is less likely, but would signal a primary down-trend.
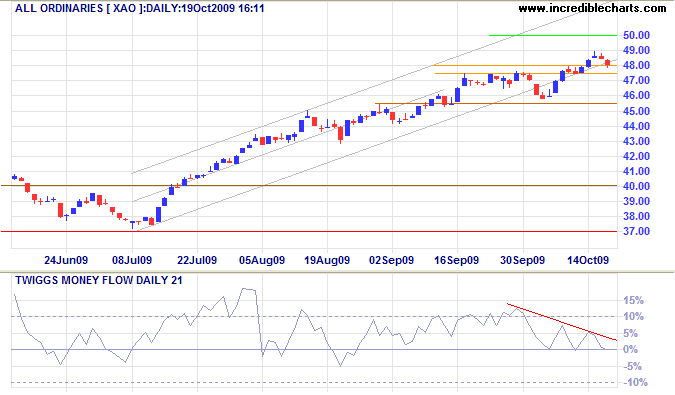
* Target calculation: 5000 + ( 5000 - 4000 ) = 6000
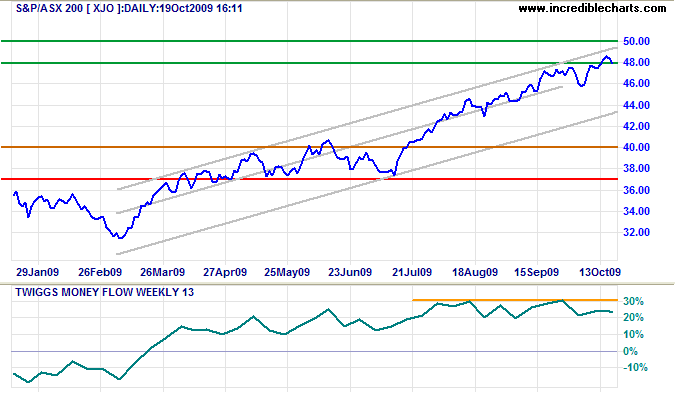
The ASX 200 is also testing support at 4800. Failure would warn of a correction to test the lower channel border. Bearish divergence on Twiggs Money Flow (13-week) signals selling pressure; reversal below 20% would strengthen the warning.
Help to keep this newsletter free! Forward this link to friends and colleagues
![]()
One of the most pervasive political visions of our time is the vision of liberals as compassionate and conservatives as less caring.
People who identify themselves as conservatives donate money to charity more often than people who identify themselves as liberals.
They donate more money and a higher percentage of their incomes.
~ Thomas Sowell
