Dow 10,000
By Colin Twiggs
October 12, 3:00 a.m. ET (6:00 p.m. AET)
These extracts from my trading diary are for educational purposes and should not be interpreted as investment or trading advice. Full terms and conditions can be found at Terms of Use.
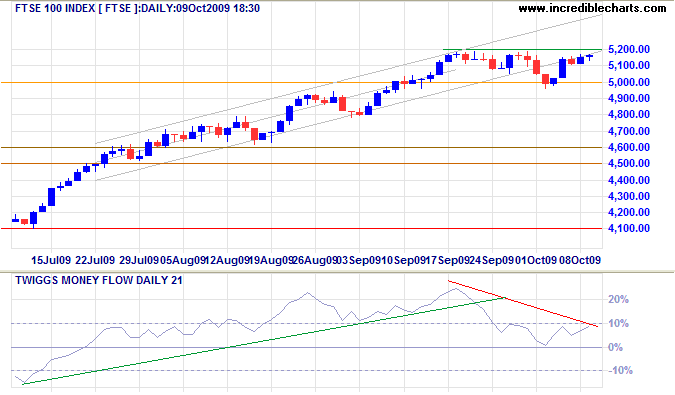
We remain in the high-risk period following the end of the third quarter. The Dow is also testing its key resistance level of 10000, while the FTSE 100 and ASX 200 are testing their key level of 5000. Upward breakout would confirm a bull market, while respect of these levels would warn of a secondary correction.
In the long term, we are not out of the woods. John Mauldin in Thoughts From The Frontline highlights recent research by Peter Bernholz (Professor of Economics at the University of Basel, Switzerland) into the causes of hyper-inflation. In his book Monetary Regimes and Inflation: History, Economic and Political Relationships, Bernholz analyzes 12 of the largest episodes of hyper-inflation in the last 20 years. All were caused by financing huge public budget deficits through money creation and he concludes that the tipping point for hyper-inflation occurs when government deficits exceed 40% of expenditures.
US budget deficits of 40 per cent or more are projected for 2009 and 2010, a clear warning despite the current credit contraction. If hyper-inflation occurs, traders would want to be short on bonds and long on real assets such as stocks, precious metals and real estate. The recent surge in gold indicates that inflationary fears are growing.
Commodities
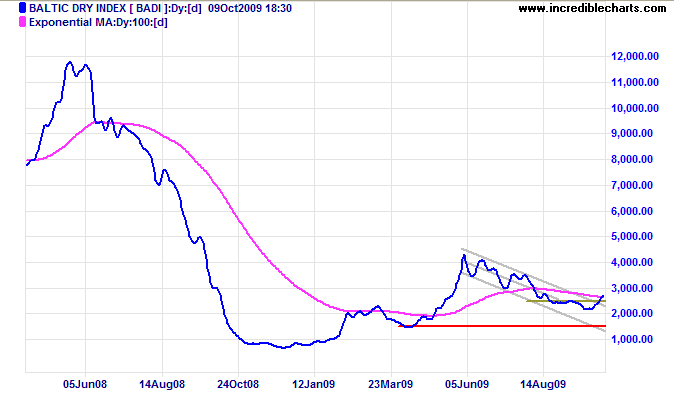
Baltic Dry Index reversal above 2500 indicates that demand for bulk commodity shipping is recovering — a positive sign for commodity prices and resources stocks. Retracement that respects the September low would signal the start of a primary advance.
The RJ/CRB Commodities Index found support at 250 and is now rallying to test 270; breakout would confirm a primary advance to 300*. Reversal below 247 is now unlikely, but would warn of reversal to a primary down-trend.
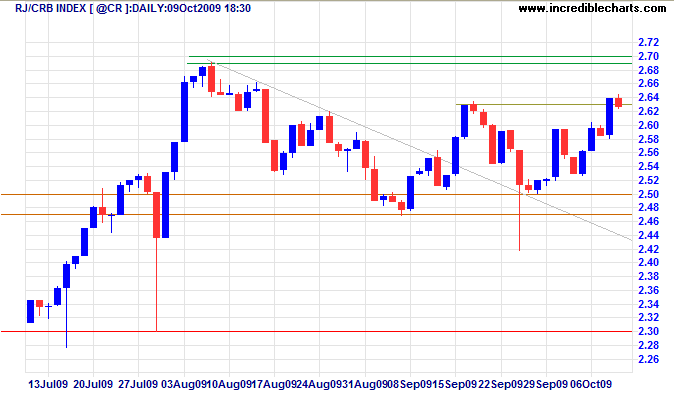
* Target calculation: 266 + ( 266 - 232 ) = 300
USA
Dow Jones Industrial Average
The Dow found support at 9500 before rallying to test 10000. Reversal below 9500 would indicate a secondary correction, while breakout above 10000 would signal another primary advance. Twiggs Money Flow (21-day), however, still shows a bearish divergence and reversal below zero would indicate a correction. In the long term, breakout above 10000 would offer a target of 12000*; failure of support at 8000 is unlikely, but would signal reversal to a primary down-trend.
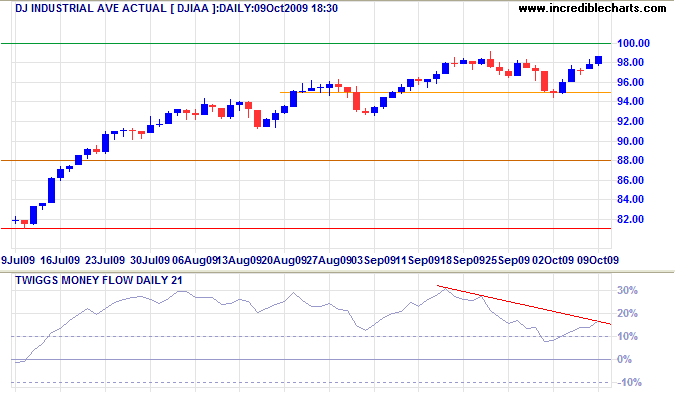
* Target calculation: 10000 + ( 10000 - 8000 ) = 12000
S&P 500
The S&P 500 is similarly headed for a test of 1100. The sharp fall on Twiggs Money Flow (13-week) indicates strong selling pressure. Failure of support at 1020 would signal a correction. In the long-term, recovery above 1100 would signal another rally to test the upper channel around 1200*; while failure of support at 900 would indicate reversal to a primary down-trend.
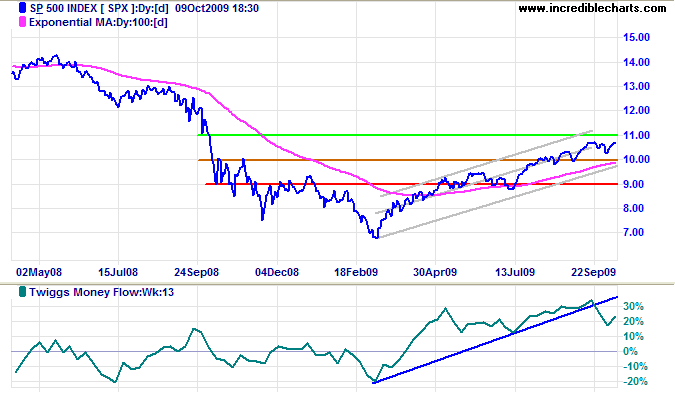
* Target calculation: 1100 + ( 1100 - 1000 ) = 1200
Transport
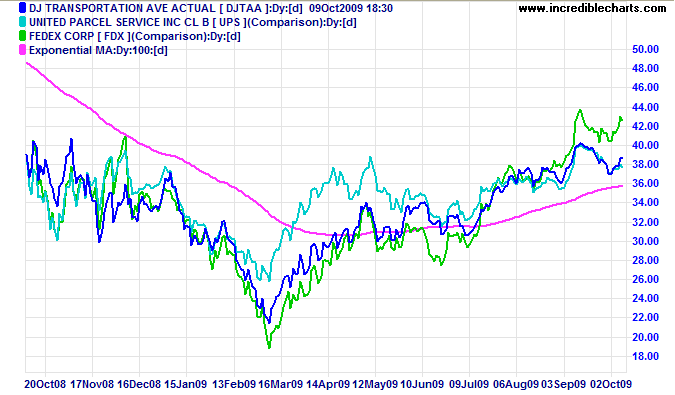
The Dow Transport Average, UPS and Fedex remain in a primary up-trend — a positive sign for the economy.
Technology
The Nasdaq 100 recovered above support at 1700. Breakout above 1750 would signal a primary advance with a target of 1900*, while reversal below 1650 would confirm a secondary correction. Bearish divergence on Twiggs Money Flow (21-day) continues to warn of a correction.
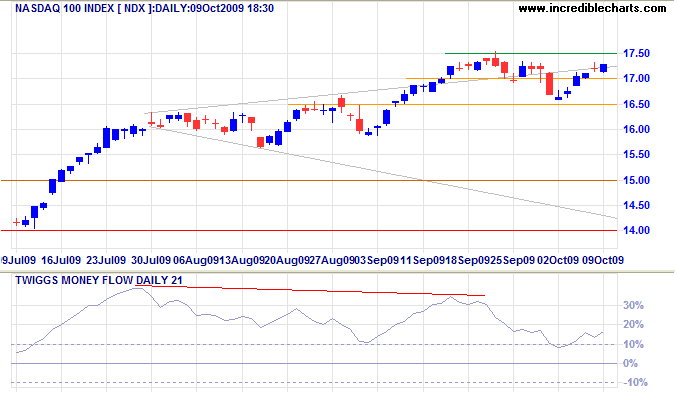
* Target calculation: 1700 + ( 1600 - 1400 ) = 1900
Canada: TSX
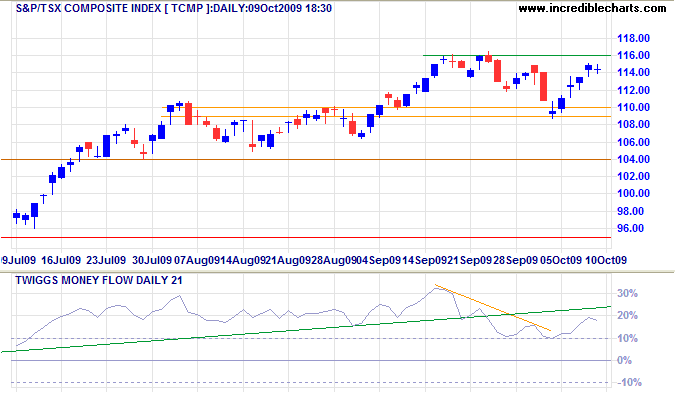
The TSX Composite recovered above support at 11000: a bullish sign. Breakout above 11600 would signal another primary advance, while reversal below 10900 would confirm a secondary correction. Twiggs Money Flow (21-day) remains bearish, below its September high; a fall below zero would confirm the correction.
United Kingdom: FTSE
FTSE 100 recovered above support at 5000: a bullish sign. Breakout above 5200 would signal another primary advance, while reversal below 5000 would confirm a secondary correction. Twiggs Money Flow (21-day) remains bearish; reversal below zero would warn of a correction.
Germany: DAX
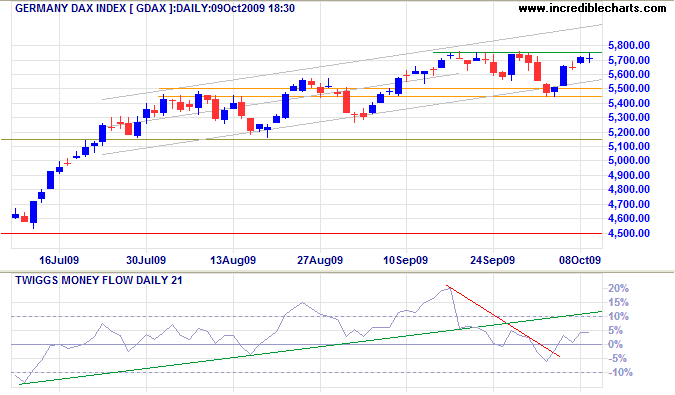
The DAX similarly recovered above support at 5500. Breakout above 5750 would signal a primary advance, while reversal below 5450 would warn of a secondary correction. Twiggs Money Flow (21-day) whipsawing around zero indicates hesitancy; retreat below -5% would strengthen the correction signal.
India: Sensex
The Sensex found resistance at 17000 and is correcting to test support, and the lower trend channel, at 16000. Failure of short-term support at 16500 would confirm the correction. Declining Twiggs Money Flow (13-week) indicates selling pressure.
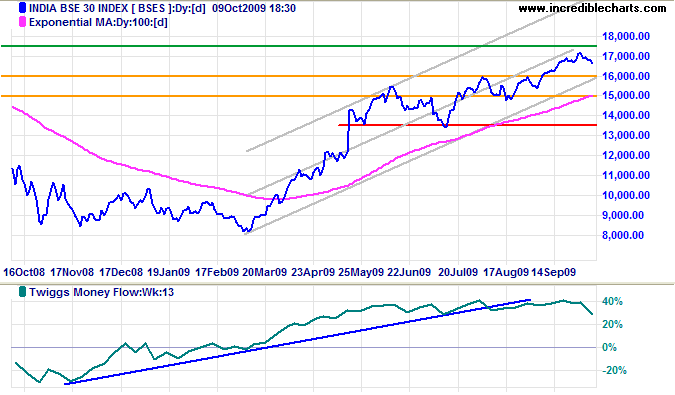
* Target calculation: 17500 + ( 17500 - 15000 ) = 20000
Japan: Nikkei
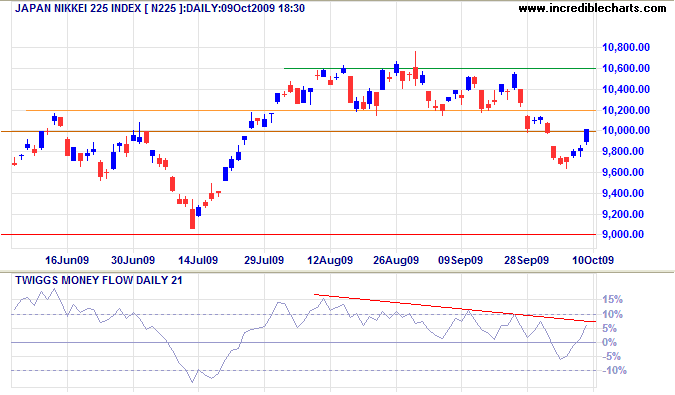
The Nikkei 225 is undergoing a secondary correction. Retracement that respects resistance at 10200 would confirm. Expect a test of primary support at 9000. Twiggs Money Flow (21-day) reversal below zero would also confirm the correction, while breakout above 10% would suggest a test of 10600.
South Korea
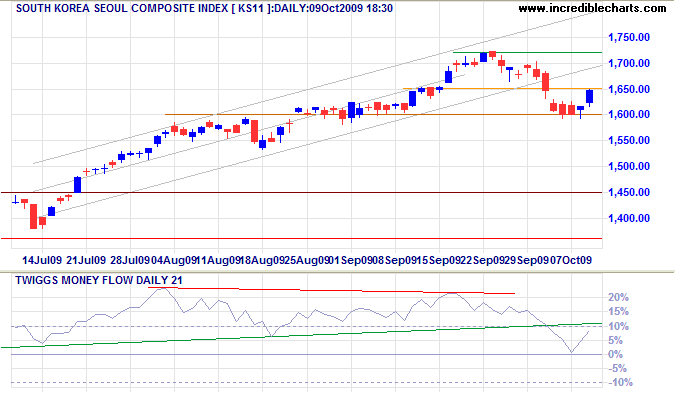
The Seoul Composite is also undergoing a secondary correction; failure of support at 1600 would confirm. Twiggs Money Flow (21-day) reversal below zero would strengthen the signal. Expect a test of 1450.
China
The Shanghai Composite Index respected primary support at 2650, rallying to test resistance at 3000/3100. Breakout above 3100 would signal the end of the correction and start of another primary advance. Twiggs Money Flow (21-day) recovery above 30% would also indicate an advance. Failure of support at 2650 is now less likely, but would signal reversal to a primary down-trend, with a medium-term target of 2300*.
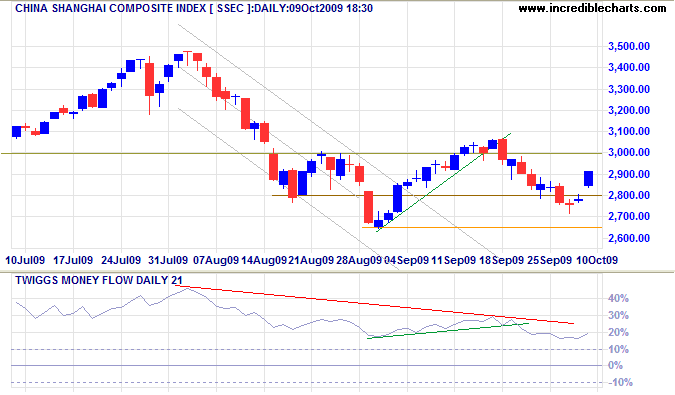
* Target calculations: 2800 - ( 3300 - 2800 ) = 2300
The Hang Seng Index also appears bullish, recovering above support at 21000. Breakout above 22000 would signal another primary advance, while reversal below 20300 would confirm the secondary correction. Bearish divergence on Twiggs Money Flow (13-week) continues to favor a correction, but recovery above the declining red trendline would indicate buying pressure. In the long term, failure of support at 19500 would signal reversal to a primary down-trend; while recovery above 22000 would offer a target of 23500*.
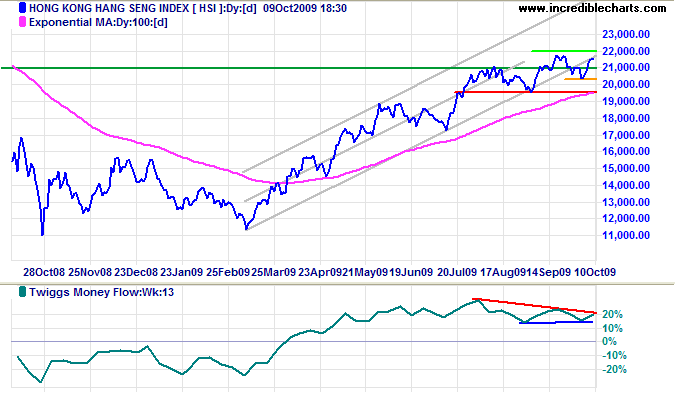
* Target calculation: 22000 + ( 22000 - 20500 ) = 23500
Australia: ASX
The All Ordinaries encountered strong resistance at 4800. Reversal below 4550 would signal a secondary correction, with a target of 4000, while breakout above 4800 would encounter the key resistance level of 5000*. Bearish divergence on Twiggs Money Flow (21-day) indicates selling pressure and a fall below zero would warn of a correction.
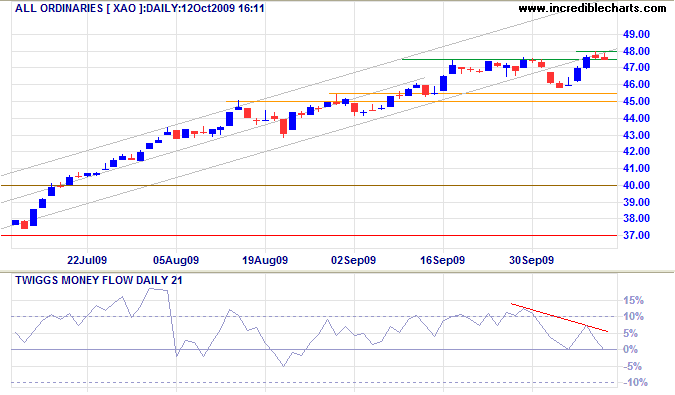
* Target calculation: 4000 + ( 4000 - 3000 ) = 5000
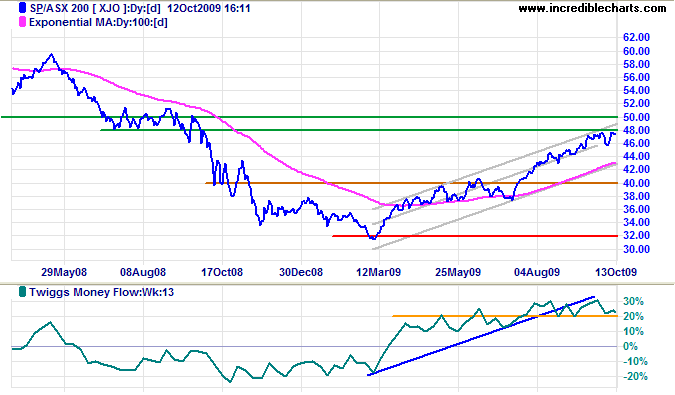
The ASX 200 is also encountering resistance at 4800, 50 percent retracement from the March low of 3200. Together with the key psychological barrier of 5000, opposition to further advances is high. Twiggs Money Flow (13-week) reversal below 20% would indicate a correction and test of the lower trend channel — as would reversal below 4550 on the price chart.
Help to keep this newsletter free! Forward this link to friends and colleagues
![]()
It ain't what you don't know that gets you into trouble.
It's what you know for sure that just ain't so.
~ Samuel L. Clemens (1835 - 1910)
