Quarter-End, Correction Risk High
By Colin Twiggs
September 26, 1:00 a.m. ET (3:00 p.m. AET)
These extracts from my trading diary are for educational purposes and should not be interpreted as investment or trading advice. Full terms and conditions can be found at Terms of Use.
We are approaching the end of the third quarter, with risk of a secondary correction elevated over the next three weeks. The Dow is also approaching a key resistance level at 10000, further increasing selling pressure. If the market does not correct soon, we run the risk of a runaway trend — and the start of another dangerous bubble.
Commodities
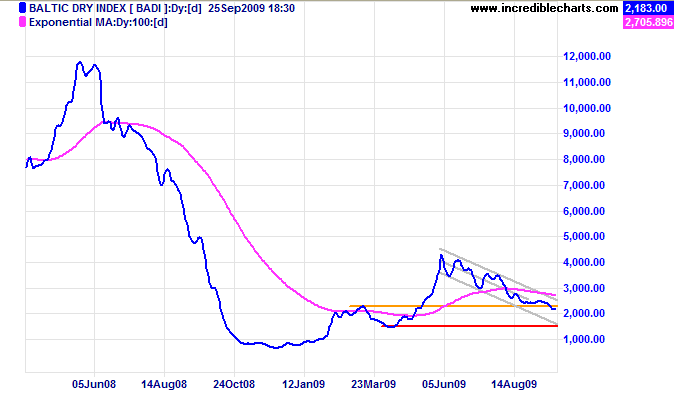
The Baltic Dry Index broke through support at 2300/2400, signaling a test of the lower channel border. The decline indicates that demand for bulk commodity shipping is slowing: a negative outlook for resources stocks. Failure of primary support at 1500 would signal reversal to a primary down-trend — and a clear warning of a W-shaped recession rather than the V-bottom we are all hoping for.
The RJ/CRB Commodities Index found support at 250, indicated by Thursday's long tail, but failed to follow through, with a rise above the high of 256, on Friday. Recovery above 260 would indicate the start of a new primary advance, while decline below 247 would warn that the correction has not ended. In the long term, breakout above 269/270 would signal a primary advance with a target of 300*; failure of support at 230, however, would indicate reversal to a primary down-trend.
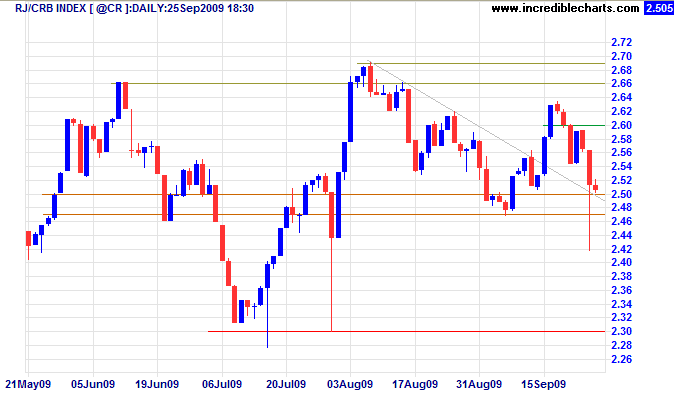
* Target calculation: 266 + ( 266 - 232 ) = 300
USA
Dow Jones Industrial Average
The Dow is retracing from the key resistance level at 10000. Breakout below the lower trend channel would warn of a secondary correction to test support at 8800/9000. Bearish divergence on Twiggs Money Flow (21-day) at this stage signals no more than short-term retracement, but reversal below zero would indicate a secondary correction. In the long term, breakout above 10000 would offer a target of 12000*, while reversal below 8000 would signal a primary down-trend.
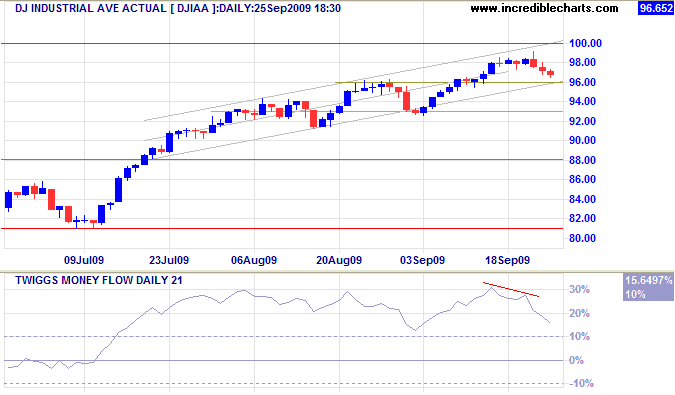
* Target calculation: 10000 + ( 10000 - 8000 ) = 12000
S&P 500
The S&P 500 reversed short of its target of 1100*. A sharp fall on Twiggs Money Flow (13-week) indicates short-term selling pressure similar to the Dow; bearish divergence over the next few weeks would indicate a secondary correction. Failure of support at 1000 would also warn of a correction.
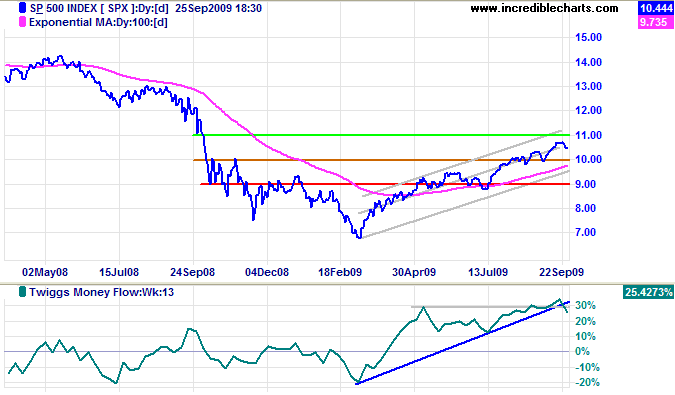
* Target calculation: 1000 + ( 1000 - 900 ) = 1100
Transport
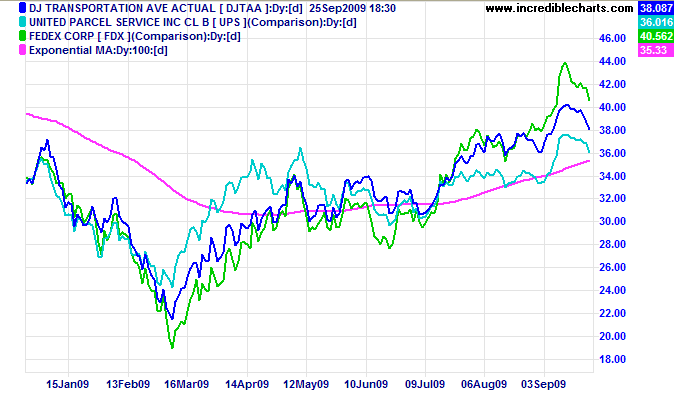
The Dow Transport Average, UPS and Fedex remain in primary up-trends, however, indicating that economic activity is improving.
Technology
The Nasdaq 100 is headed for a test of the lower trend channel, reversing well short of its target of 1900*. The sharp drop in Twiggs Money Flow (13-week) signals short-term selling pressure. Breakout below the trend channel, or a bearish divergence on TMF 13-week, would warn of a secondary correction.
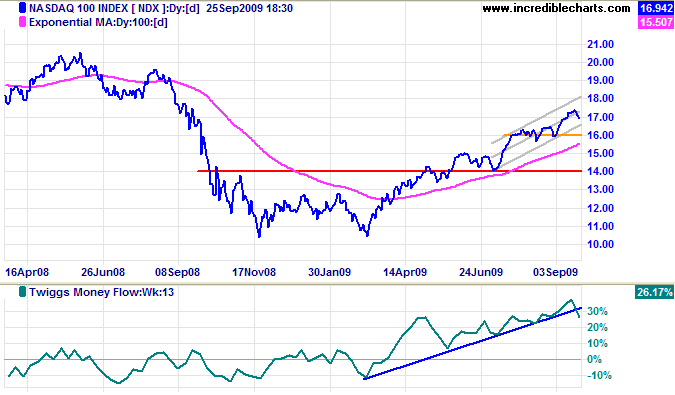
* Target calculation: 1700 + ( 1600 - 1400 ) = 1900
Canada: TSX
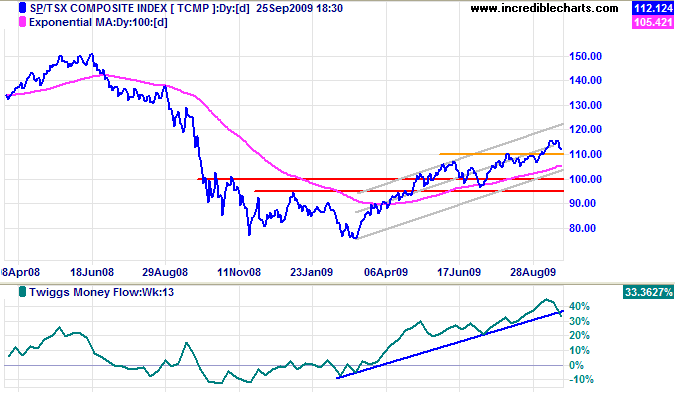
The TSX Composite is retracing to test support at 11000; failure would warn of a secondary correction to the lower trend channel. Twiggs Money Flow (13-week) penetration of its rising trendline indicates short-term selling pressure; bearish divergence over the next few weeks would also warn of a secondary correction.
United Kingdom: FTSE
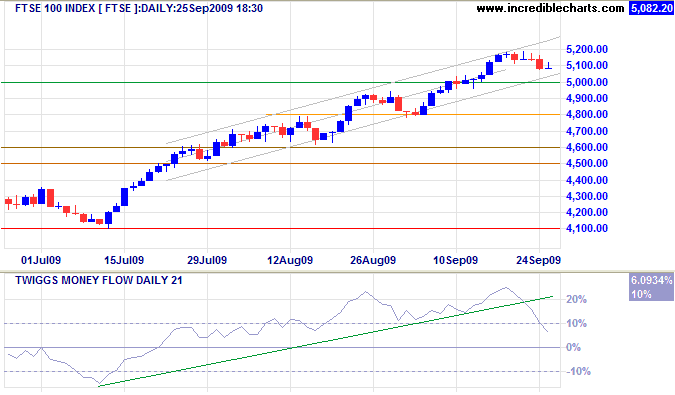
The FTSE 100 is retracing to test the new support level at 5000; failure of support would warn of a secondary correction. Twiggs Money Flow (21-day) reversal below zero would increase the likelihood of a correction.
Germany: DAX
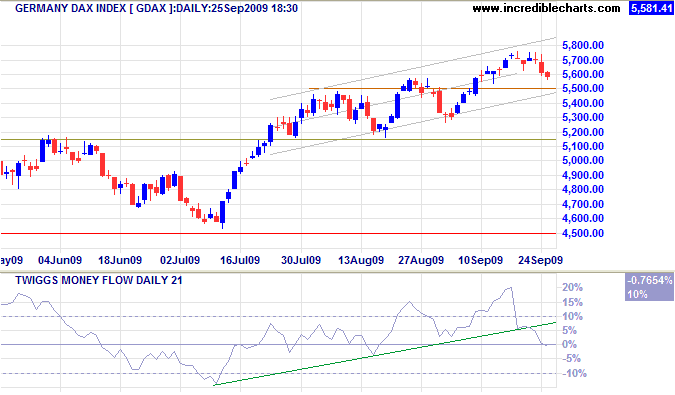
The DAX is headed for a test of support at 5500; failure would warn of a secondary correction. Twiggs Money Flow (21-day) sharp fall to below zero indicates a correction.
India: Sensex
The Sensex continues its primary advance towards 17500*. Twiggs Money Flow (21-day) holding well above zero indicates long-term buying pressure.
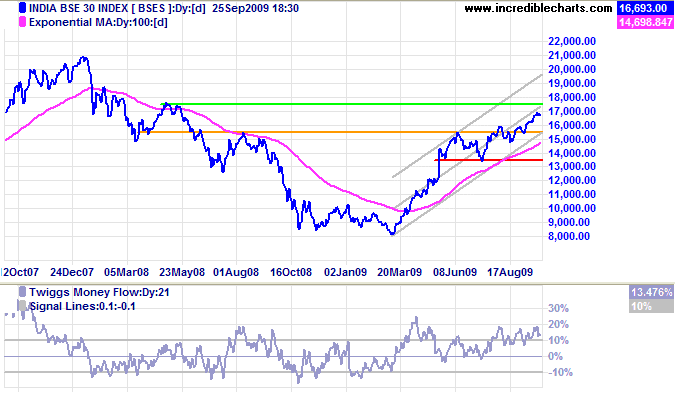
* Target calculation: 15500 + ( 15500 - 13500 ) = 17500
Japan: Nikkei
The Nikkei 225 continues to consolidate between 10200 and 10600. Breakout below 10200 would signal a secondary correction — as would Twiggs Money Flow (21-day) reversal below zero. Failure of support at 10000 would offer further confirmation. Recovery above 10600 is unlikely at present, but would indicate a primary advance with a target of 11000*.
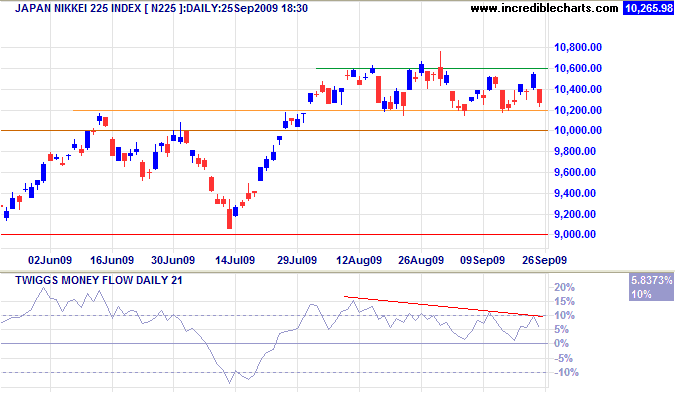
* Target calculation: 10000 + ( 10000 - 9000 ) = 11000
South Korea
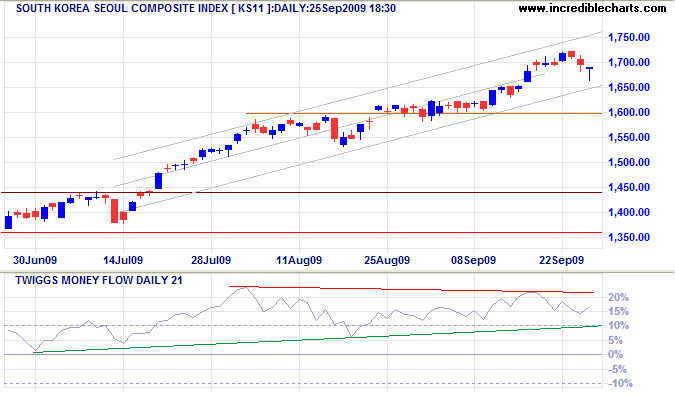
The Seoul Composite Index is retracing to test its lower trend channel. Breakout below the channel would warn of a secondary correction; confirmed if support at 1600 fails. Twiggs Money Flow (21-day) breakout from its medium-term triangle would indicate future direction.
China
The Shanghai Composite Index retreated below the key 3000 level and is now testing support at 2800. Failure would warn of another down-swing with a target of 2300*; confirmed if medium-term support at 2650 is broken. Descending Twiggs Money Flow (13-week) indicates long-term selling pressure.
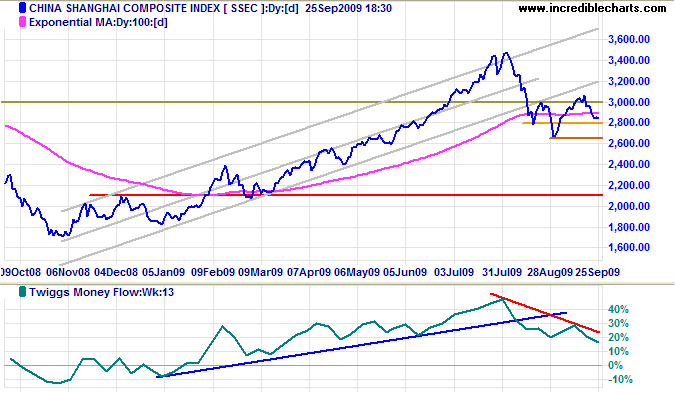
* Target calculations: 2800 - ( 3300 - 2800 ) = 2300
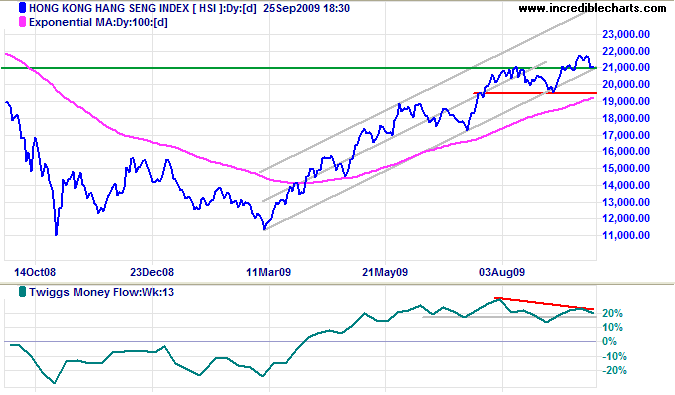
The Hang Seng Index retraced to test the new support level at 21000; breakout would warn of a secondary correction. Bearish divergence on Twiggs Money Flow (13-week) also indicates a correction. In the long term, failure of support at 19500 would signal reversal to a primary down-trend; while recovery above 21000 would suggest another primary advance.
Australia: ASX
Weak commodity prices threaten resources stocks, but the All Ordinaries displays a bullish narrow consolidation at 4700, suggesting an advance to test the key 5000* resistance level. Rising Twiggs Money Flow (21-day) indicates buying pressure, increasing the likelihood of an advance. Breakout below the rising trend channel is unlikely, but would warn of a secondary correction.
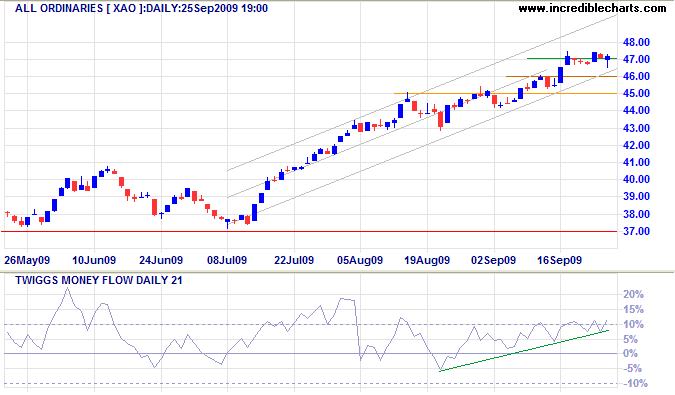
* Target calculation: 4000 + ( 4000 - 3000 ) = 5000
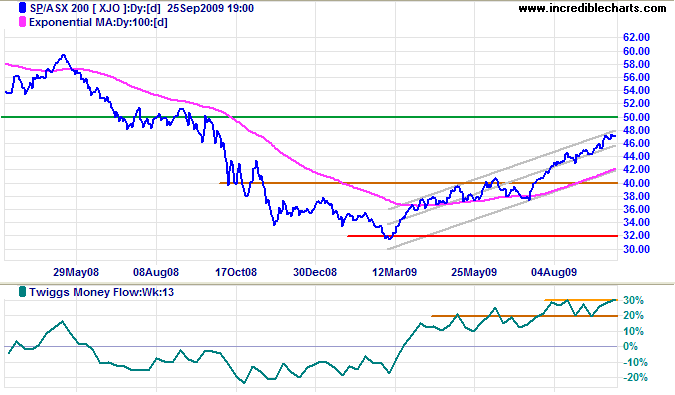
The ASX 200 is advancing towards the key 5000 resistance level. Rising Twiggs Money Flow (13-week) signals long-term buying pressure. We are approaching the quarter-end and many other indexes reflect selling pressure, but so far there are no signs (e.g. bearish divergence) of an imminent secondary correction.
Reminder: This is no blue sky rally. Enjoy it while it lasts. But the financial system remains on life support and we are not out of the woods yet.
Help to keep this newsletter free! Forward this link to friends and colleagues
![]()
Every citizen should be a soldier. This was the case with the Greeks and Romans, and must be that of every free state.
~ Thomas Jefferson (1743 - 1826)
