Keep Stops Tight
By Colin Twiggs
July 28, 3:00 a.m. ET (5:00 p.m. AET)
These extracts from my trading diary are for educational purposes and should not be interpreted as investment or trading advice. Full terms and conditions can be found at Terms of Use.
This is no blue sky rally. The bear market is taking a rain-check while equities undergo a period of hopeful exuberance. Unemployment is rising, however, and the economy contracting — albeit at a slower pace. Rallies are not always driven by improving fundamentals, but those that are not seldom last. Bear market rallies are mostly sparked by the contraction of short interest as an initial price surge forces shorts to cover. But unless joined by long-term investors, spurred by improving fundamentals, they soon run out of steam as the short interest dwindles.
The current up-trend has shown more stamina and cannot be dismissed as a typical bear market rally. Some long-term investors have obviously drunk the Kool-Aid. But how long will this last?
This is not a typical recession. Our global monetary (and banking) system is broken and we will have to invent a new one. The US, UK and Japan are accumulating debt at an alarming pace, with no serious prospect of repayment — other than monetizing the debt, which would cause hyper-inflation. The situation is massively unstable.
Enjoy the rally while it lasts. But bear in mind that it could end badly. And keep your stops tight.
USA
Dow Jones Industrial Average
The Dow broke through 9000, signaling a primary advance to 10000*. Declining volume indicates a scarcity of available stock which should drive further gains. Narrow consolidation above the new support level is a short-term bull signal. Reversal below 8800 is unlikely, but would warn of a bull trap.
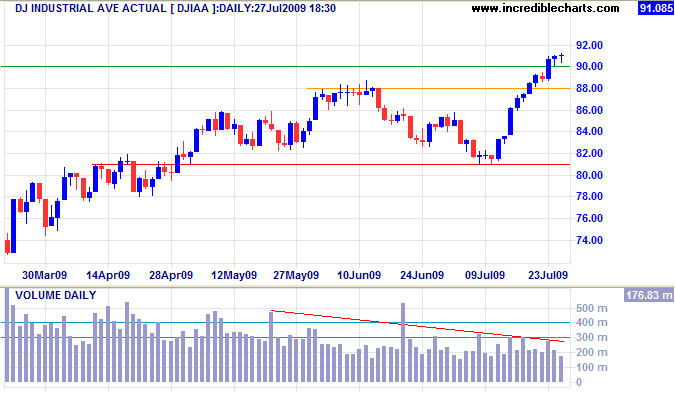
* Target calculation: 9000 + ( 9000 - 8000 ) = 10000
S&P 500
The S&P 500 confirmed the Dow up-trend with a breakout above 950. The index is headed for a test of 1000. Breakout would indicate a primary advance with a target of 1300*, the August 2008 high. Rising Twiggs Money Flow (13-Week) confirms the up-trend. Reversal below 950 is now unlikely, but would warn of a bull trap.
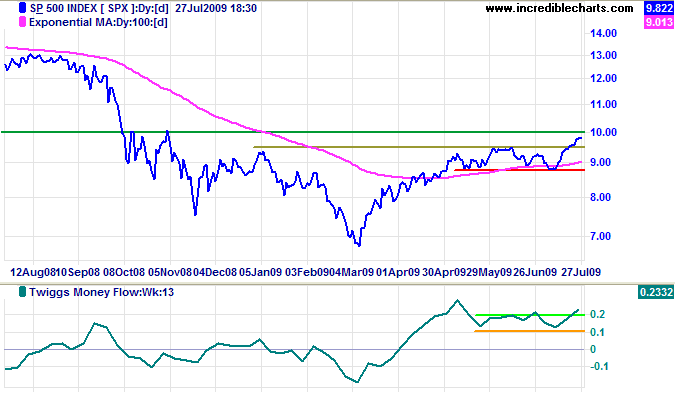
* Target calculation: 1000 + ( 1000 - 700 ) = 1300
Transport
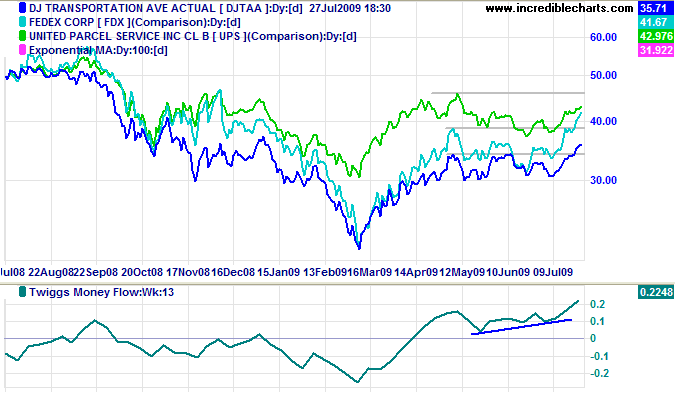
The Dow Transport Average broke through resistance at 3400 to confirm the new up-trend. Rising Twiggs Money Flow (13-Week) confirms the up-trend. Bellwether stock Fedex accompanied the breakout, but UPS still has to exceed its May high.
Technology
The Nasdaq 100 formed a small bullish consolidation below resistance at 1600. Breakout is likely and would signal an advance to 1700*. Rising Twiggs Money Flow (13-Week & 21-Day) indicates strong buying pressure.
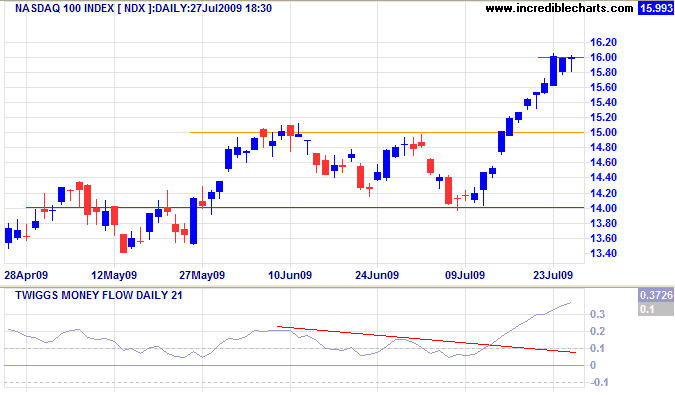
* Target calculation: 1600 + ( 1600 - 1500 ) = 1700
Canada: TSX
The TSX Composite broke through resistance at 10700, signaling a primary advance with a target of 11700*. Rising Twiggs Money Flow (13-Week & 21-Day) indicates strong buying pressure. Reversal below 10400, while unlikely, would warn of a bull trap.
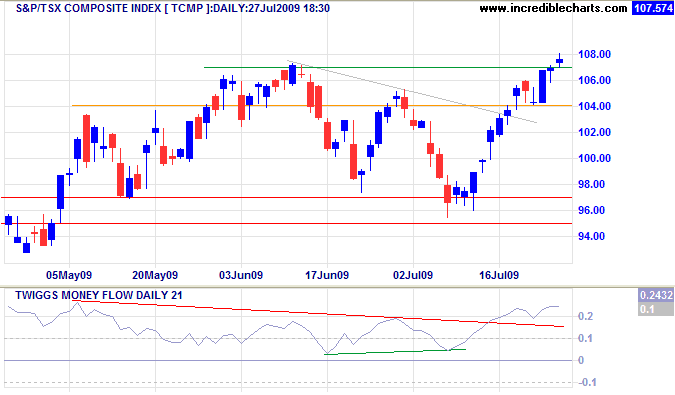
* Target calculation: 10700 + ( 10700 - 9700 ) = 11700
United Kingdom: FTSE
The FTSE 100 broke through 4500 to signal a primary advance with a target of 5000*. Twiggs Money Flow (21-Day) turned back towards zero, indicating a retracement to test the new support level. Reversal below 4350 is unlikely, but would warn of a bull trap.
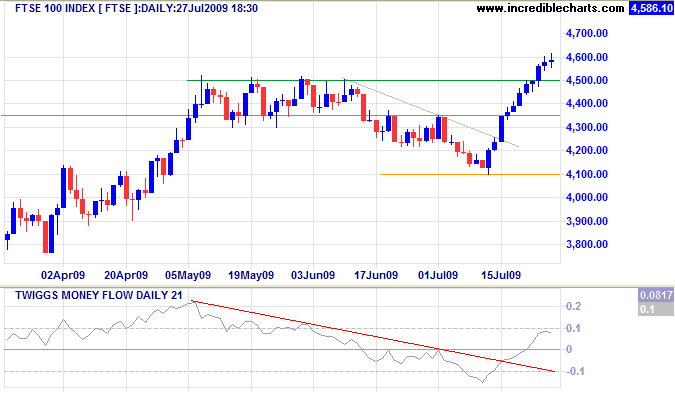
* Target calculation: 4500 + ( 4500 - 4000 ) = 5000
Europe: DAX
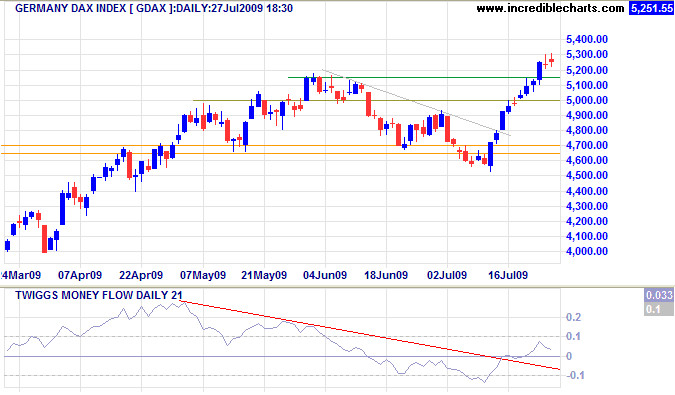
The DAX likewise indicates retracement to test the new support level at 5150. Reversal below 5000 is unlikely, but would warn of a bull trap. Twiggs Money Flow (21-Day) respect of the zero line would indicate a further advance.
India: Sensex
The Sensex is testing resistance at 15500; breakout would signal a primary advance with a target of 17500*. Twiggs Money Flow (21-Day) respecting the zero line indicates buying pressure. Reversal below 14800 is unlikely, but would warn of another down-swing to test 13200.
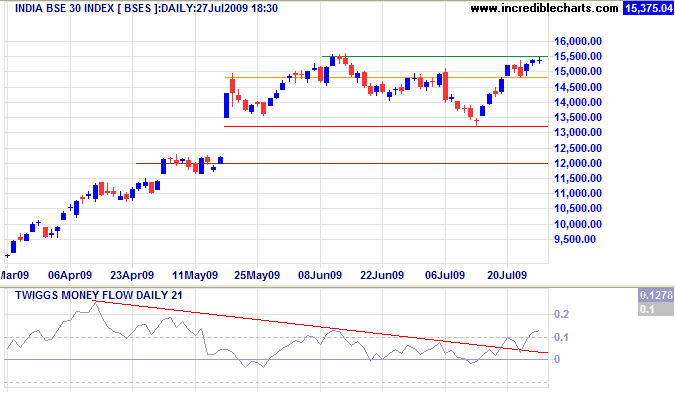
* Target calculation: 15500 + ( 15500 - 13500 ) = 17500
Japan: Nikkei
The Nikkei 225 is testing resistance at 10200; breakout would signal a primary advance with a target of 11000*. Twiggs Money Flow (21-Day) remains weak; unless the next retracement respects zero, breakout is unlikely. Reversal below 10000 would warn of another down-swing to test 9000.
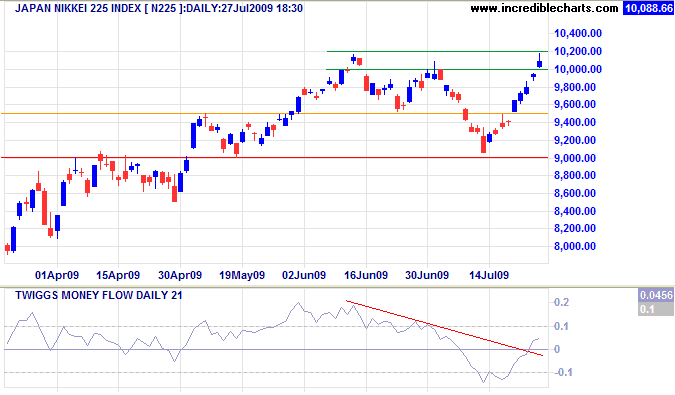
* Target calculation: 10000 + ( 10000 - 9000 ) = 11000
South Korea
The Seoul Composite Index broke through resistance at 1450, signaling a primary advance with a target of 1700*. Rising Twiggs Money Flow (13-Week) confirms the up-trend. Reversal below 1450 is unlikely, but would warn of a bull trap.
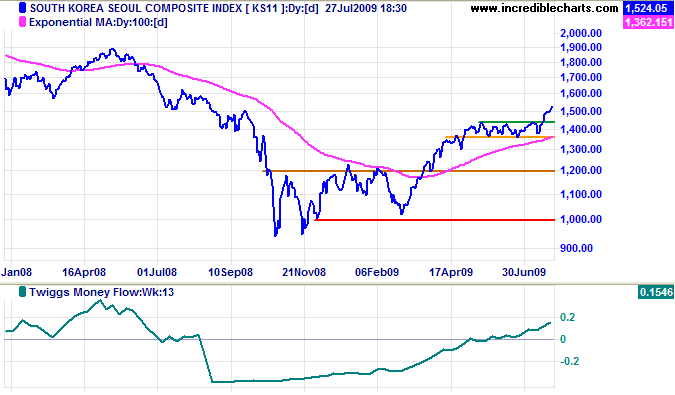
* Target calculation: 1450 + ( 1450 - 1200 ) = 1700
China
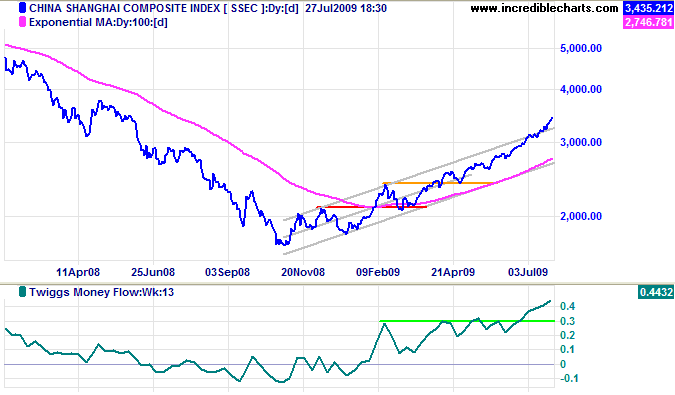
The Shanghai Composite Index continues in an accelerating up-trend (sometimes referred to as a "runaway trend"). Rising Twiggs Money Flow (13-Week) signals unusually strong buying pressure. While the up-trend may continue for some months, the absence of strong corrections make market support increasingly precarious.
The Hang Seng broke through resistance at 19000, signaling another primary advance with a target of 21000*. Rising Twiggs Money Flow (13-Week & 21-Day) indicates strong buying pressure. Reversal below 19000 is most unlikely, but would warn of a bull trap.
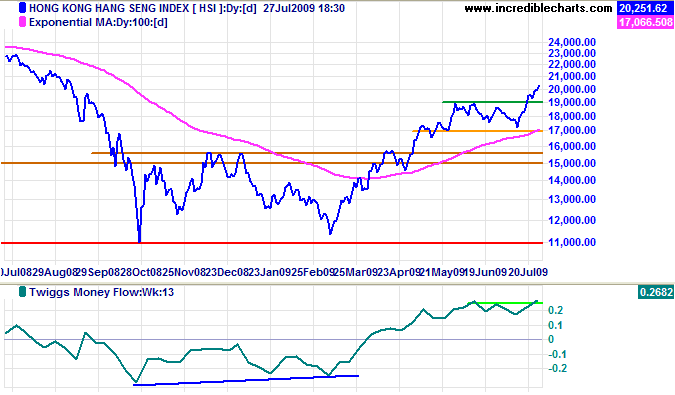
* Target calculation: 19000 + ( 19000 - 17000 ) = 21000
Australia: ASX
The CRB Commodities Index broke out above its downward-sloping trendline, indicating that the secondary correction is weakening, but has yet to recover above 255 to confirm. Recovery would be a bullish sign for resources stocks. Breakout above 270 would signal a primary advance with a target of 310*. Reversal below 230 is unlikely, but would warn of a test of primary resistance at 200.
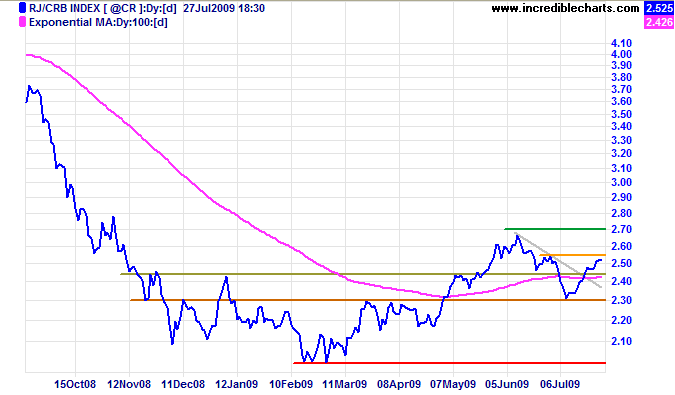
* Target calculation: 270 + ( 270 - 230 ) = 310
The All Ordinaries continues its primary advance with a target of 4500*. Twiggs Money Flow (21-Day) signals buying pressure, but do not rule out retracement to test the new support level. Reversal below 4000 is unlikely, but would warn of a bull trap.
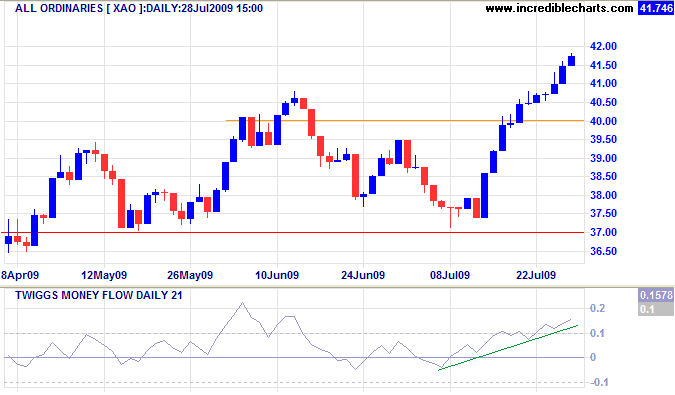
* Target calculation: 4100 + ( 4100 - 3700 ) = 4500
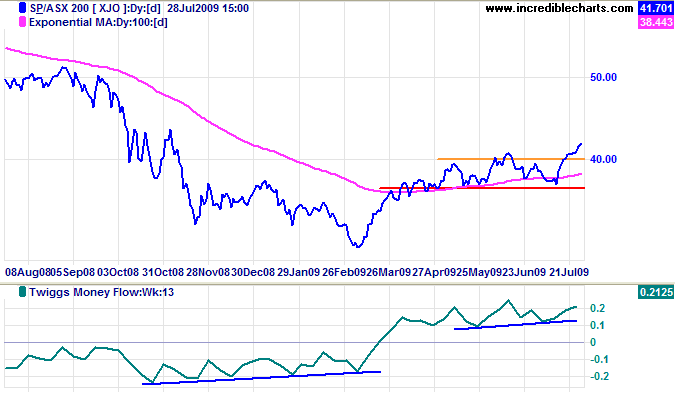
ASX 200 breakout above 4050 signals another primary advance — confirming the All Ords signal. Rising Twiggs Money Flow (13-Week) indicates an up-trend. Reversal below 4000 is unlikely, but would again warn of a bull trap.
Help to keep this newsletter free! Forward this link to friends and colleagues
![]()
That government is best which governs the least, because its people discipline themselves.
~ Thomas Jefferson (1743 - 1826)
