Gold Rally Weakens
By Colin Twiggs
March 31, 2009 00:30 a.m. (3:30 p.m. AET)
These extracts from my trading diary are for educational purposes and should not be interpreted as investment or trading advice. Full terms and conditions can be found at Terms of Use.
Gold
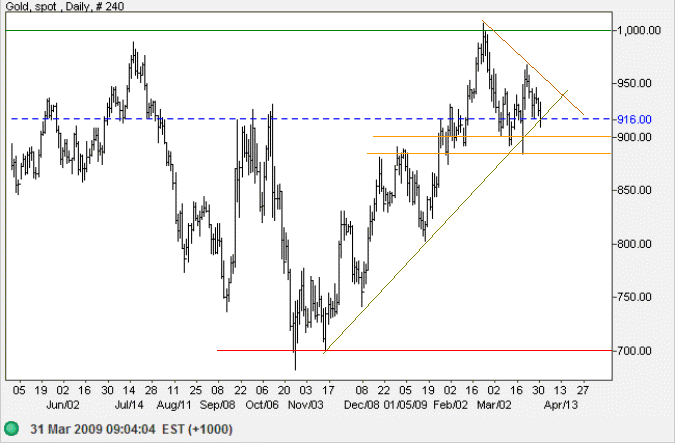
Spot gold is headed for a test of short-term support at $900. Breakout below $890 would signal the end of the rally of recent months and a test of primary support at $700. Reversal above the descending trendline, however, would indicate another test of $1000.
Inflation is likely to remain muted in the next twelve months, easing demand for gold as an inflation hedge.
Source: Netdania
Crude Oil
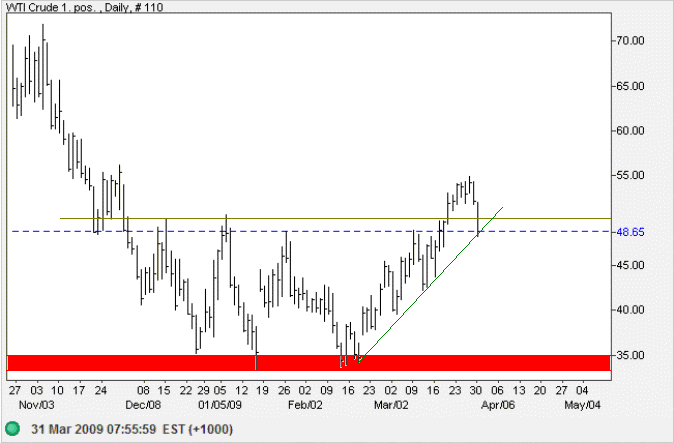
West Texas Crude reversed below support at $50 per barrel, threatening a bull trap. Clear breakout below the rising trendline would signal that the rally of the last few weeks is over — and test of support between $33 and $35 is likely.
OPEC is unlikely to cut production sufficiently to match shrinking demand as the global economy contracts. Expect prices to fall.
Source: Netdania
Silver
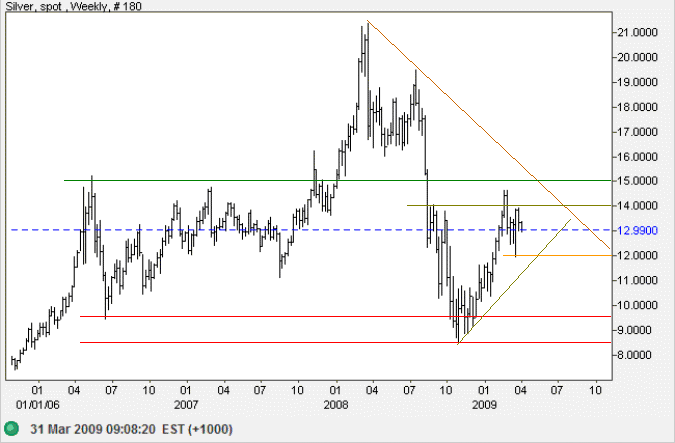
Silver is headed for a test of support at $12 after encountering resistance at $15. A break of support would signal a test of primary support at $8.50. Reversal above $14, while less likely, would make another test of $15. The weekly chart shows a clear primary down-trend and reversal below $12 would be a warning for gold bugs.
Source: Netdania
US Dollar Index
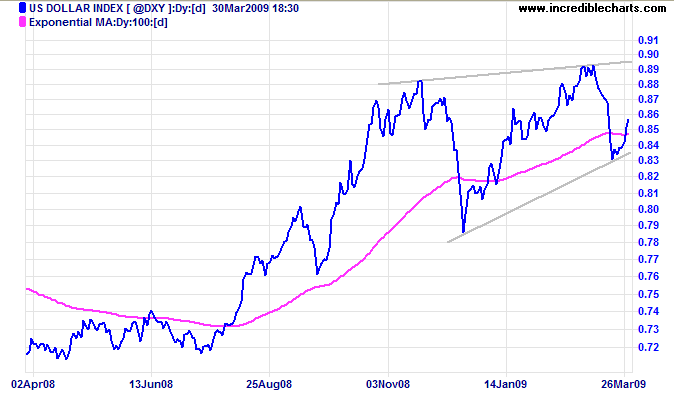
The US Dollar Index shows a rising wedge pattern, warning of a reversal. A swing that fails to reach the upper border would strengthen the signal. Downward breakout would place upward pressure on gold prices.
Australian Resources Sector
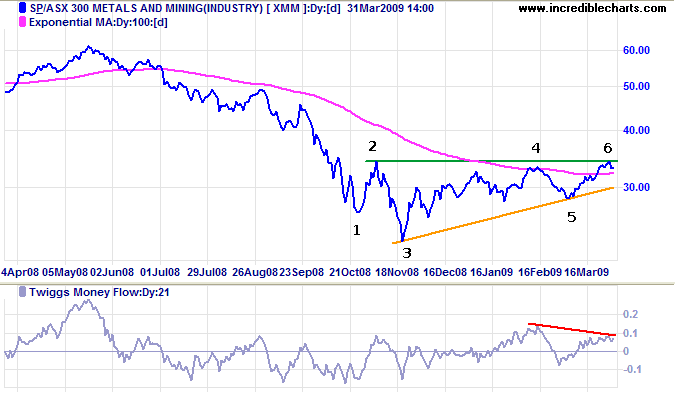
The Australian Metals & Mining index displays an ascending triangle with resistance at 3500. There is some argument over whether this should be recognized as a valid pattern because the first reversal point [1] does not form part of the pattern. Edwards & Magee often include points, like [2], formed prior to the start of the pattern, while John Murphy starts at the first reversal point in the pattern [3] and works forward. Thank you to Vern for highlighting this issue.
Breakout above 3400 would indicate a primary trend reversal, but bearish divergence on Twiggs Money Flow (21-Day) warns of selling pressure. Reversal below 3000 would warn of another down-swing — with a target of 1900 (calculated as 3000 - [ 3400 - 2300 ]).
Dow Jones Industrial Average
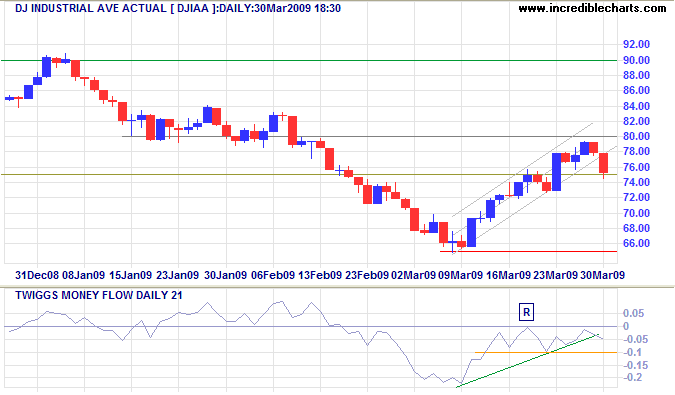
The Dow reversed below resistance at 8000 on light volume. More from a lack of buyer's interest than from an increase in sellers. Twiggs Money Flow (21-Day) reversal below -0.1 would warn of another down-swing. Breakout below support at 6500 would confirm — and offer a target of 5000 (calculated as 6500 - [ 8000 - 6500 ]).
We are selling off our future and the future of our children to prevent the bondholders of U.S. financial corporations from taking losses
.....Even Bear Stearns' bondholders can expect to get 100% of their money back....
~ John Hussman
