Bullish Divergences
By Colin Twiggs
March 22, 11:30 p.m. ET (2:30 p.m. AET)
These extracts from my trading diary are for educational purposes and should not be interpreted as investment or trading advice. Full terms and conditions can be found at Terms of Use.
Markets such as Japan, Canada, Australia and India show bullish divergences on long-term Twiggs Money Flow (13-week). My concern is that US and European markets are weak. All eyes should remain on the elephant in the lifeboat: if the Dow breaks support, positive sentiment in most secondary markets will be overwhelmed.
USA
Dow Jones Industrial Average
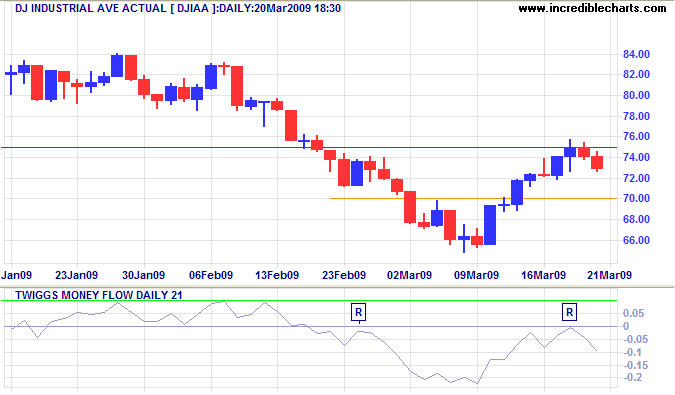
The Dow encountered strong resistance at 7500, with narrow ranges and large volume.
High volume on Friday is attributable to triple-witching hour, which occurs on the third Friday of March, June, September and December.
Twiggs Money Flow (21_day) respected the zero line from below, warning of another down-swing.
The medium-term target is now 5500,
calculated as
6500 - ( 7500 - 6500 ).
S&P 500
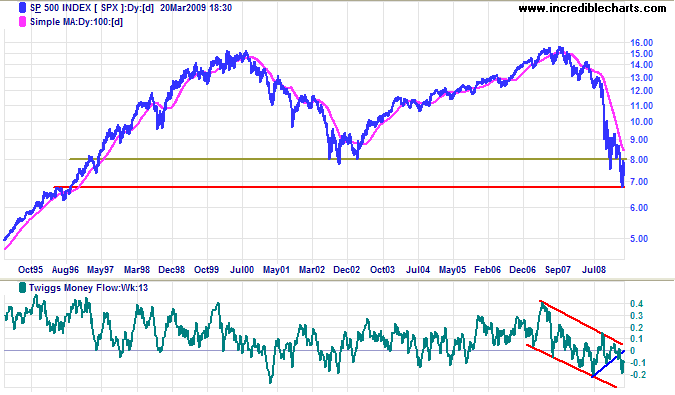
The S&P 500 found similar resistance at 800,
and offers a medium-term target of 550; calculated as
675 - ( 800 - 675 ).
Twiggs Money Flow (13-Week) holding below zero signals continuation of
the primary down-trend.
Technology
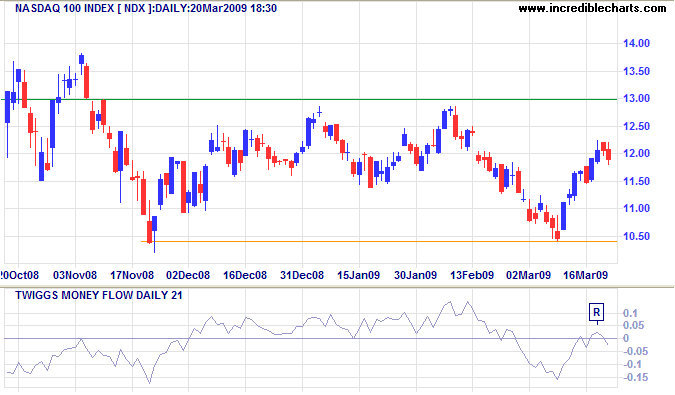
The Nasdaq 100 encountered resistance at 1200, with Twiggs Money Flow (21-Day) respecting the zero line from below to warn of a test of support at 1040. Failure would offer a long-term target of 800; calculated as 1050 - ( 1300 - 1050 ).
Canada: TSX
The TSX Composite encountered resistance at the upper border of the descending broadening wedge pattern and is likely to re-test support at 7500. Failure of support would offer a medium-term target of 6200; calculated as 7500 - ( 8800 - 7500 ). Twiggs Money Flow (13-Week) displays a bullish divergence, but whipsawing around the zero line indicates hesitancy. In the long term, the primary trend remains down — with a target of the October 2002 low of 5700.
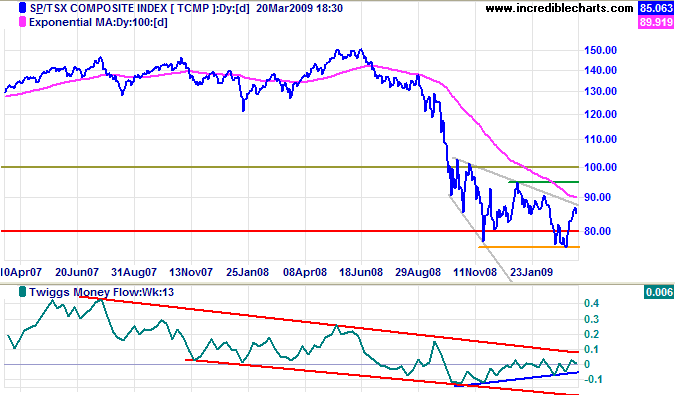
Breakout from the descending broadening wedge (above) would not provide a reliable signal as the pattern occurs in a down-trend, instead of its usual position as a consolidation during an up-trend.
United Kingdom: FTSE
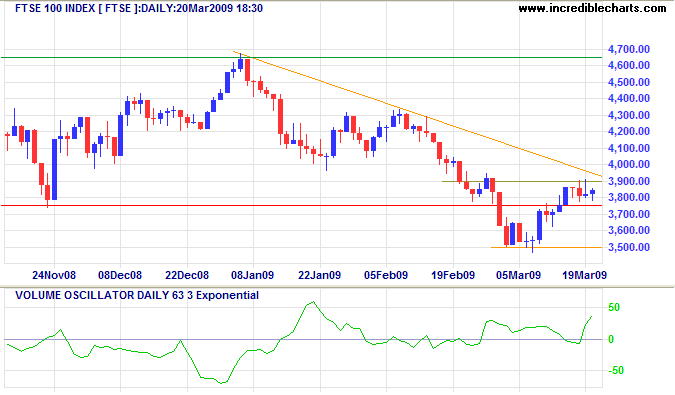
The FTSE 100 is consolidating in a narrow range between 3750 and 3900 — a continuation pattern when accompanied by falling volume. Rising volume, however, warns of selling pressure. In the long term, the primary trend is down, with a target of 3000; calculated as 3800 - (4600 - 3800).
Europe: DAX
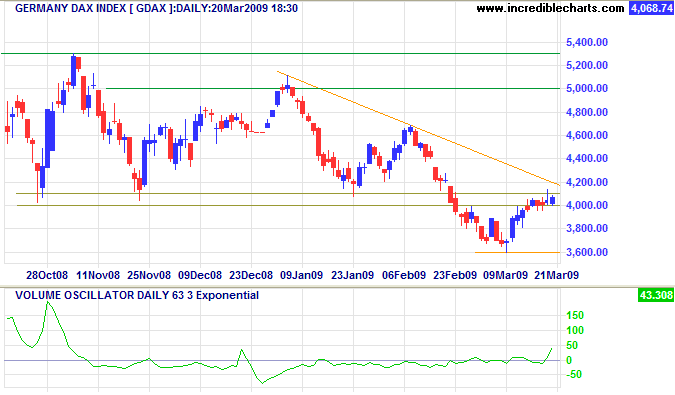
The DAX is similarly consolidating between 4000 and 4100, with rising volume warning of a reversal. In the long term, the primary trend is down, with a target of 3000; calculated as 4000 - (5000 - 4000).
India: Sensex
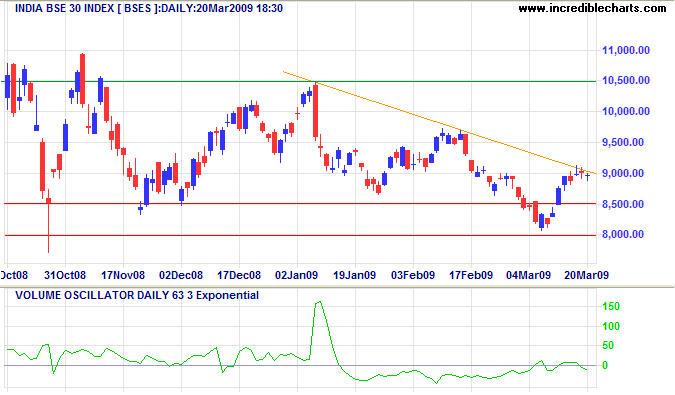
The Sensex encountered resistance at 9000, but declining volume indicates the rally may continue. A close above 9000 would signal a test of 10500. Reversal, on the other hand, would test 8000. In the long term, the primary trend is down, with a target of 6500; calculated as 8500 - ( 10500 - 8500 ). Twiggs Money Flow (13-Week), however, displays a bullish divergence similar to the Nikkei below, warning of reversal to an up-trend.
Japan: Nikkei
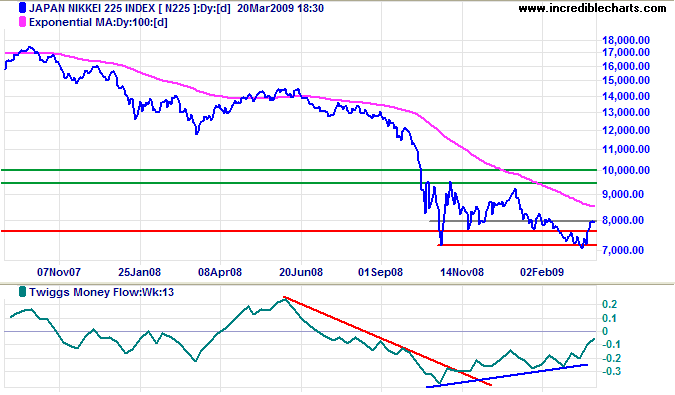
The Nikkei 225 is testing resistance at 8000. Declining volume (not shown) indicates continuation of the rally is likely. Twiggs Money Flow (13-Week) displays a bullish divergence and recovery above the zero line would indicate a primary trend reversal. In the long term, a rise above 9500 would complete a wide double bottom reversal, with a target of 12000. Retreat below 7000, on the other hand, would signal a primary down-swing with a target of 5000.
China
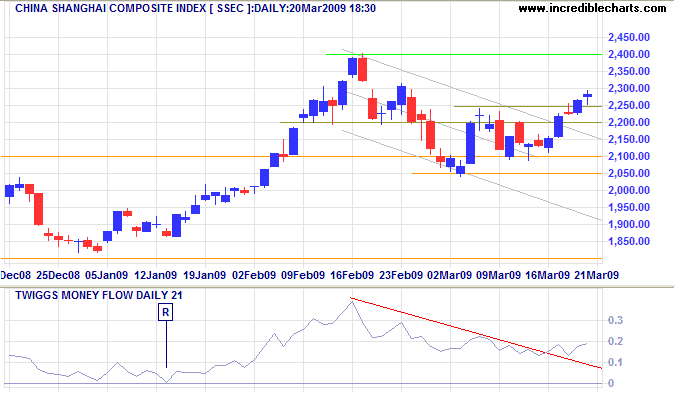
The Shanghai Composite respected support between 2100 and 2050, and is now rallying towards a test of the February high of 2400. Breakout would confirm a strong primary up-trend. Reversal below 1800 is now unlikely, but would signal a primary down-trend.
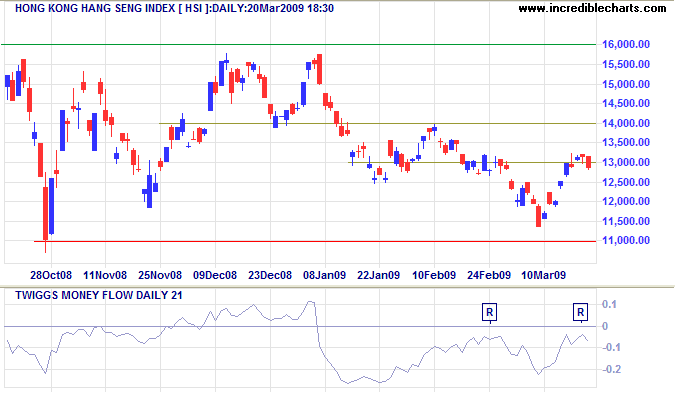
The Hang Seng Index, however, continues to signal weakness, with Twiggs Money Flow (21-Day) failing to cross above the zero line. The index found resistance at 13000 and reversal would test primary support at 11000. In the long term, the primary trend is down and breakout below 11000 would offer a target of 8500 — the April 2003 low.
Australia: ASX
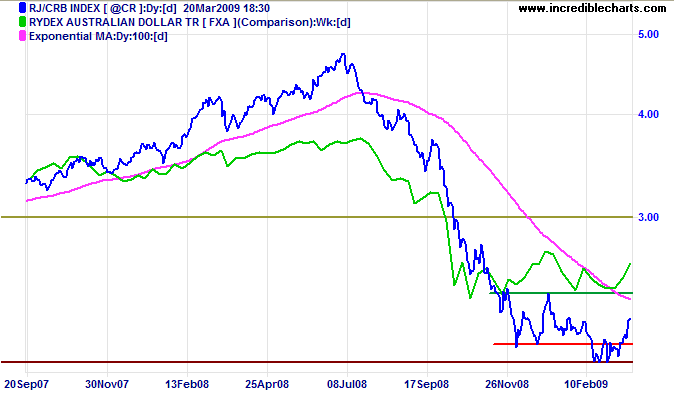
The CRB Commodities Index rallied off support at 200. Commodities prices may be boosted by Fed efforts to expand the money supply, but are nowhere near a primary up-trend. Too early for commodity exporters like Australia to get excited.
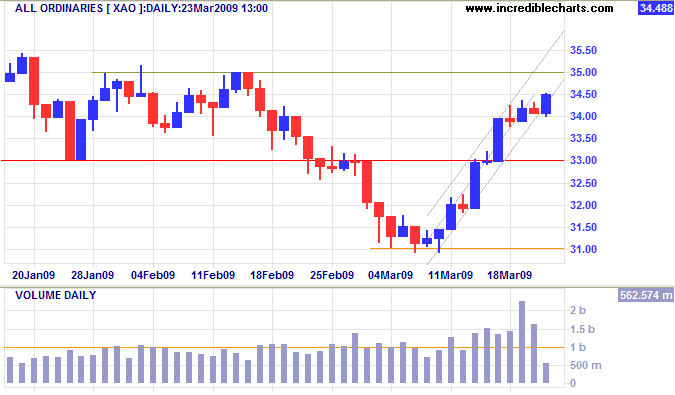
The All Ordinaries overcame resistance at 3400 despite strong volumes — a positive sign. Expect further resistance at 3500, while breakout above 3750 would complete a wide double bottom reversal with a target of 4300. Reversal below 3300, however, would warn of a down-swing with a target of 2700 — the March 2003 low.
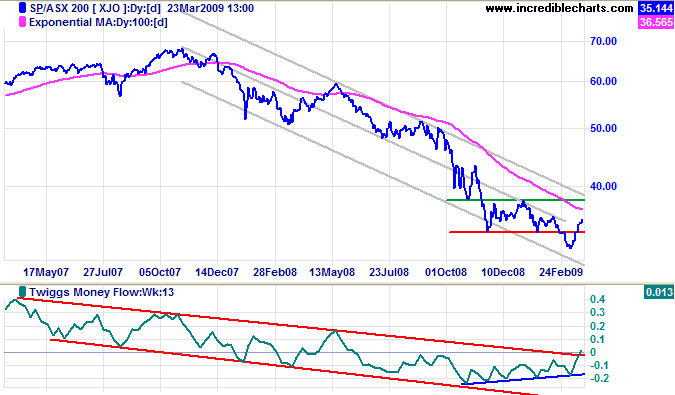
ASX 200 reversal above 3800 would likewise offer a target of 4300. Until then, the target for the primary down-trend remains the March 2003 low of 2700. Twiggs Money Flow (13-Week) crossing above zero, however, completes a bullish divergence — warning of a primary trend reversal.
The problem is not that people are taxed too little,
the problem is that government spends too much.
~ Ronald Reagan.
