Monetary Base False Signal
By Colin Twiggs
December 13, 10:00 p.m. ET (11:00 a.m. AET)
These extracts from my trading diary are for educational purposes and should not be interpreted as investment or trading advice. Full terms and conditions can be found at Terms of Use.
The monetary base, sometimes referred to as "high-powered money" or "narrow money", consists of currency in circulation and bank deposits held in the federal reserve system. There has been some alarm at the spectacular 70 percent jump in recent weeks: rapid growth in the money supply would debase the currency.
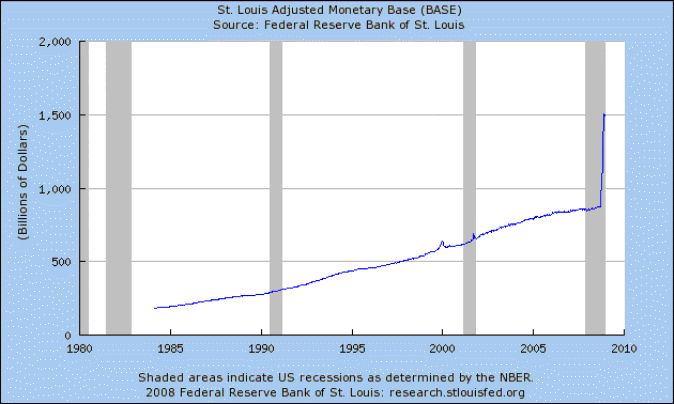
The spike in the monetary base is, however, misleading. Excess reserves on deposit with the Fed have surged by almost $600 billion since September 2008 — and are included in the monetary base. Previously the Fed paid no interest on reserves, ensuring that banks maintained only minimum balances on deposit. Now the Fed pays interest on all reserve deposits and, from November 6, increased the rate to their target rate of 1.0 percent. The Fed has positioned itself as intermediary to ensure the free flow of funds — encouraging banks to deposit excess reserves with them rather than lend at lower effective rates in the interbank market. Increases in excess reserve deposits have no connection to expanding bank credit.
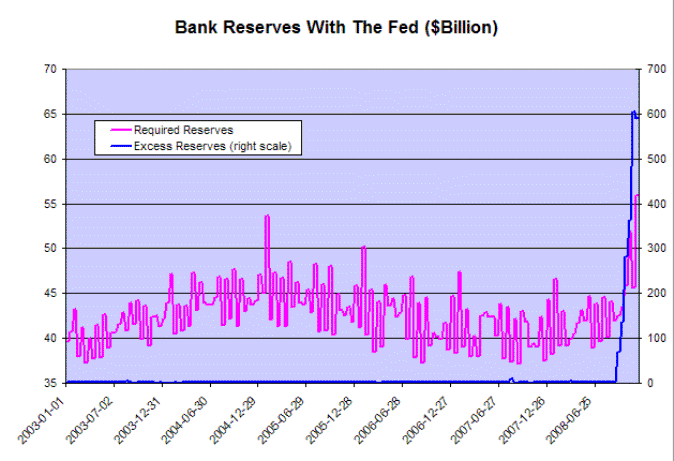
Required bank reserves also increased, by roughly 20 percent in recent months: nowhere near as severe as the spike in the monetary base. The rise is largely explained by two factors: introduction of reserves from investment houses who converted to regulated banks; and by Fed attempts to offset contraction of the shadow banking sector: "unregulated deposits" in commercial paper, reverse repos, and money markets that avoided reserve requirements.
Gold
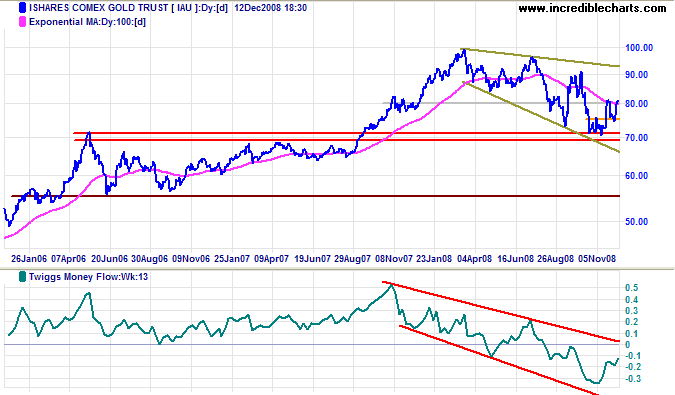
Spot gold is testing resistance at $830. Breakout is likely and would signal a test of the upper border of the bearish descending wedge formation. Respect would indicate another test of $700 — and ultimately the June 2006 low of $550.
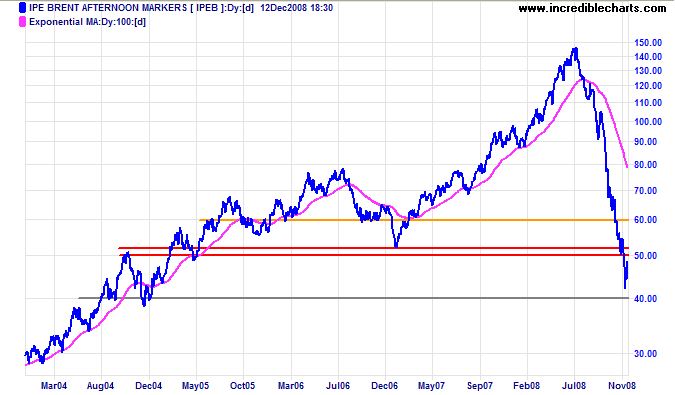
Crude oil is retracing after testing support at the December 2004 low of $40 per barrel. Expect resistance at $50. In the longer term, failure of support would offer a target of $25.
Interbank Lending
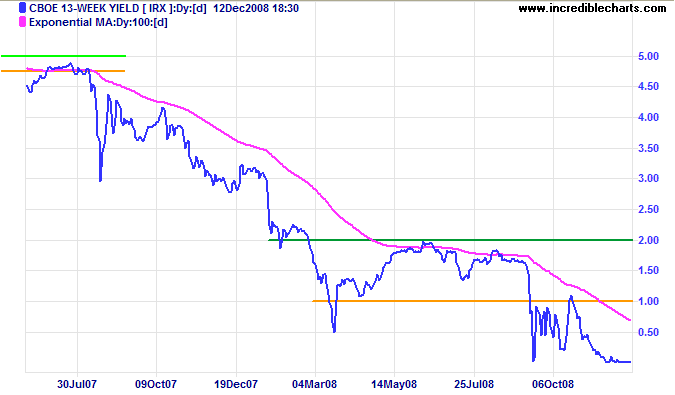
Confidence remains low. Yields on 3-month Treasury Bills close to zero indicate that investors are wary of higher yields in the shadow banking sector.
USA
Dow Jones Industrial Average
The Dow is consolidating between 8000 and 9000. Twiggs Money Flow (21-day) holding above zero indicates that upward breakout is more likely — which would signal another test of 10000. Reversal below 8000 would indicate a test of the 2002 low of 7300.
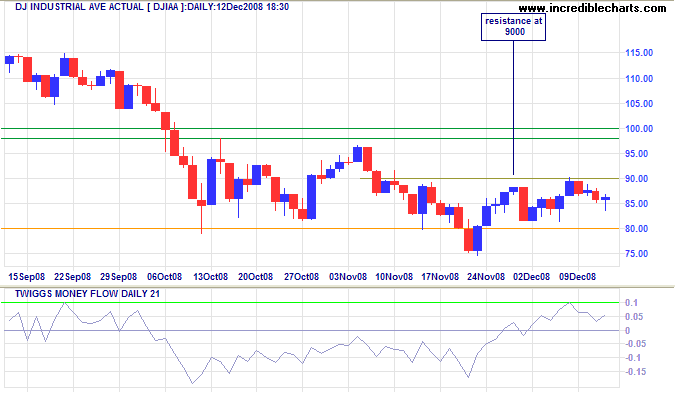
Long Term: The primary trend is down and rallies are likely to be of the sucker variety. Penetration of the 2002 low of 7300 would offer a long-term target of 6000; calculated as 8000 - ( 10000 - 8000 ).
S&P 500
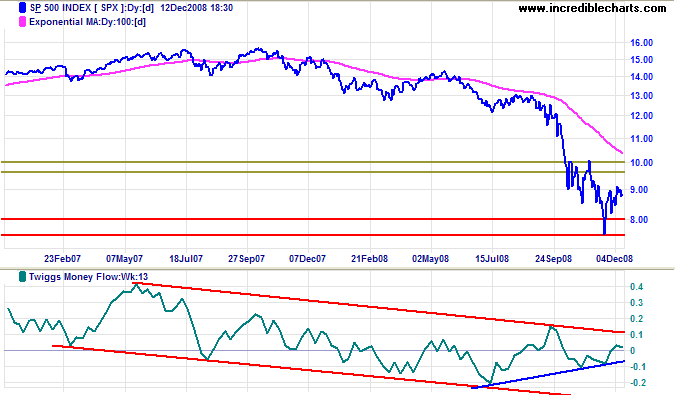
The S&P 500 also hints at a bear market rally in the short/medium-term. The primary trend remains down. Upward breakout from the Twiggs Money Flow (13-week) trend channel would warn of a trend reversal.
Canada: TSX
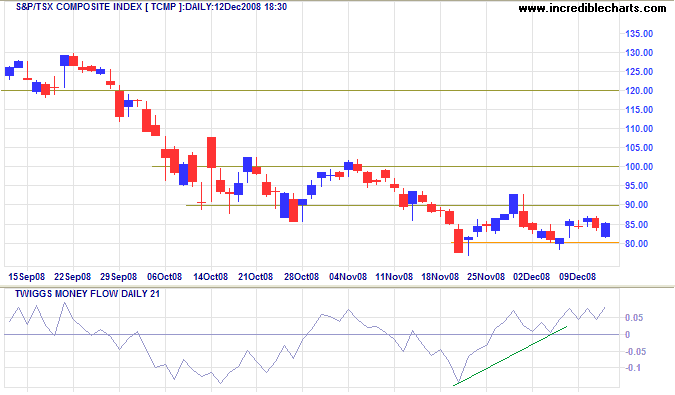
The TSX Composite is consolidating between 8000 and 9000. Twiggs Money Flow (21-Day) holding above zero signals that an upward breakout is more likely — which would test 10000. The primary trend is down, however, and reversal below 8000 would offer a target of 6000, calculated as 8000 - (10000 - 8000).
United Kingdom: FTSE
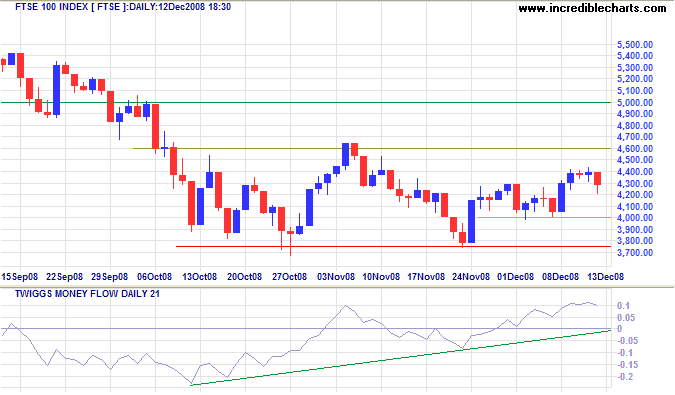
The FTSE 100 continues in a large consolidation between 3800 and 4600, signaling uncertainty. The current rally is headed for a test of the upper border at 4600. Rising Twiggs Money Flow (21-day) indicates that upward breakout is more likely — offering a target of the September 2008 high of 5600. The primary trend is down, however, and likely to persist. Breakout below 3800 would signal a primary down-swing, with a target of 3000; calculated as 3800 - (4600 - 3800).
Europe: DAX
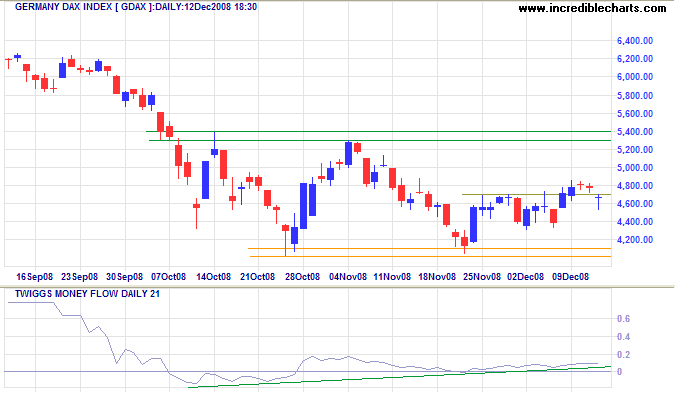
The DAX continues in a consolidation between 4000 and 5300. Twiggs Money Flow (21-day) holding above zero indicates a test of the upper border. In the longer term, breakout above 5300 would signal a bear market rally with a target of 6500, calculated as 5300 + (5300 - 4100); while breakout below 4000 would offer a target of 3000, calculated as 4200 - (5300 - 4100).
India: Sensex
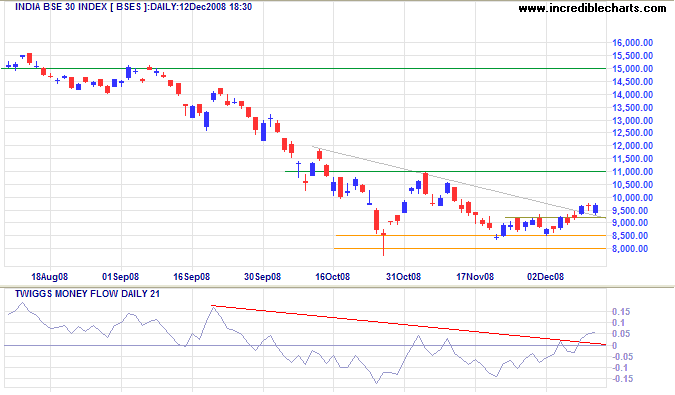
The Sensex respected 8500 for a second time. Rising Twiggs Money Flow (21-Day) indicates another test of 11000. In the longer term , the primary trend is down and breakout below 8500 would offer a target of the 2005 low of 6000; calculated as 8500 - ( 11000 - 8500 ).
Japan: Nikkei
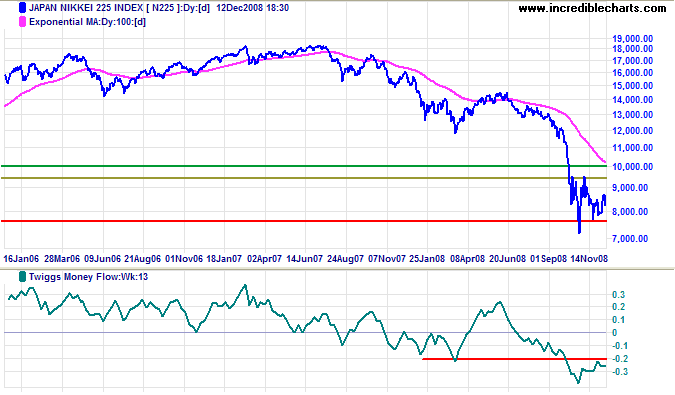
The Nikkei 225 also shows a short/medium-term rally, but the primary trend is down and unlikely to reverse in the present climate. Twiggs Money Flow (13-week) confirms long-term selling pressure. Breakout below 7700 would offer a target of 4500, calculated as 7000 - (9500 - 7000). Recovery above 8500 is unlikely — and would test 9500.
China
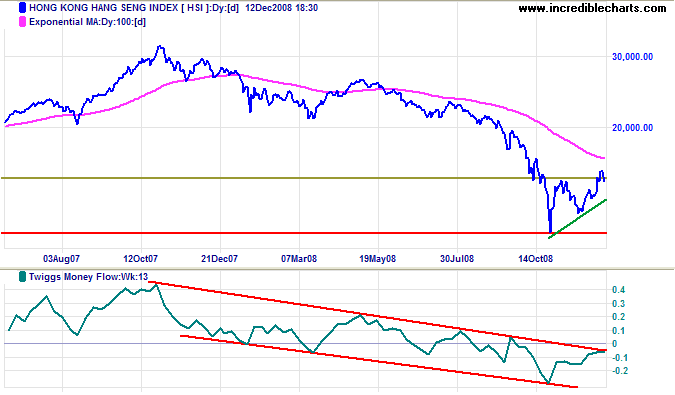
The Hang Seng index in isolation signaled a primary trend reversal, with breakout above the previous high of 15000. Twiggs Money Flow (13-week) remains in a downward trend channel and the breakout lacks confirmation, subsequently reversing below 15000 to test the rising trendline. In the longer term, breakout above 15000 would offer a target of 20000, while reversal below 11000 would suggest a target of 8500, the 2003 low.
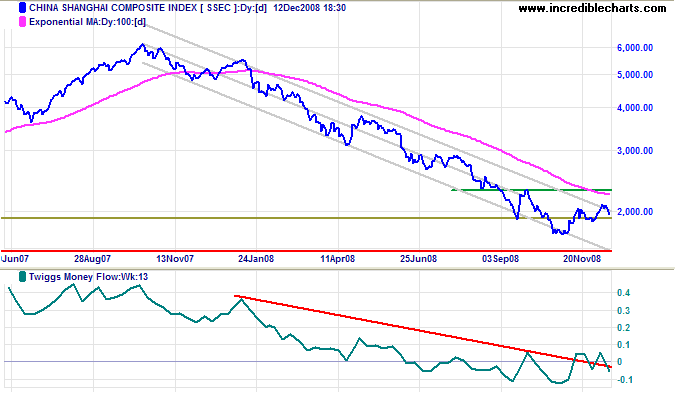
The Shanghai Composite is testing the upper border of the trend channel. Reversal below 1800 would signal a down-swing to test the lower channel border around 1500. Clear breakout above the trend channel would warn of a primary trend reversal, and Twiggs Money Flow (13-week) reversal to an up-trend would strengthen the signal.
Australia: ASX
The All Ordinaries is edging lower, consolidating between 3300 and 3700, the former support level. Twiggs Money Flow (21-day) holding below the zero line warns of selling pressure.
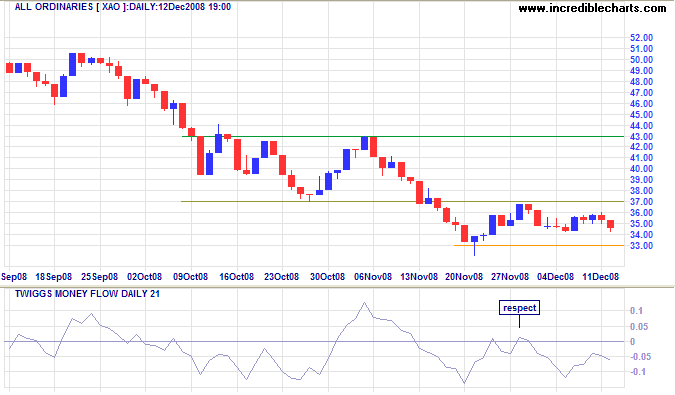
Long Term: The primary trend is down and breakout below 3300 would offer a target of 2700, the 2003 low.
The assumption that spending more of the taxpayer's money will make things better has survived all kinds of evidence that it has made things worse.
~ Thomas Sowell
