Liquidity Trap
By Colin Twiggs
November 8, 5:00 a.m. ET (8:00 p.m. AET)
These extracts from my trading diary are for educational purposes and should not be interpreted as investment or trading advice. Full terms and conditions can be found at Terms of Use.
Most of us have heard these re-assuring words from at least one economist in recent weeks: "Don't worry. This is not another Great Depression. We have learned a lot since then." What have we learned? In 1929 investors had a currency backed by gold; nowadays our dollars are backed by an IOU from the world's biggest debtor. In 1929 the financial system was far less sophisticated: accounts were tallied with pen and paper. Today we have sophisticated financial models which we trust implicitly — until they fail to predict the impending collapse. In 1929 communication was largely by mail. Today we are all inter-connected, with communications around the globe measured in milliseconds. In 1929 the relatively new Fed was still cautiously finding their way and regularly making mistakes. Today we have a Fed confidently patrolling the financial markets with a huge can of gasoline, ready to douse any new flare-ups. And promising to use as much gas as it takes to restore stability.
In 1929 voters distrusted government and any big spending programs were likely to be met by howls of outrage. Roosevelt won election in 1932 by criticizing Hoover's huge deficits, advocating "immediate and drastic reductions of all public expenditures," "abolishing useless commissions and offices, consolidating bureaus and eliminating extravagances reductions in bureaucracy," and for a "sound currency to be maintained at all hazards." His New Deal program then went on to do exactly the opposite, far surpassing any previous excesses. Today we have House majority leaders who subscribe to the same New Deal philosophy of big government spending in order to "rescue" the economy.
Why am I not confident that we are in good hands? The mistakes being made threaten to dwarf those of 1929. Leaders seem to be ignorant that negative real interest rates and budget deficits are the same gasoline that caused the fire in the first place. If they continue along their present path, the inevitable conflagration will make the Great Depression seem like a backyard barbecue by comparison.
Liquidity Trap
The Fed rapidly lowered interest rates in an attempt to stimulate borrowing, but has so far achieved little response. The banking and business sectors are focused on deleveraging: selling assets in order to reduce debt on their balance sheets. The effective fed funds rate, meanwhile, has fallen below 0.50 percent, warning us to expect further cuts.
The economy is headed for a liquidity trap, where interest rates offered on bank deposits are too low to attract investors. An outflow of funds from banks would force them to liquidate assets, unless the Fed prints more money to shore up their balance sheets.
If banks are forced to liquidate assets, calling in loans would set off a downward spiral similar to the 1930s. Borrowers are forced to liquidate investments, forcing prices lower and placing banks under even greater threat, with collateral value of stocks and real estate no longer covering the nominal value of loans.
Continual debasement of the currency, on the other hand, leads to another trap where investors lose faith in the currency. Provoking a flight to gold and other portable stores of value — in effect an alternative currency. In 1933 Roosevelt had to ban private individuals from holding gold in order to prevent this. Legislation that was only revoked in 1974.
Economic Models
Economics has attracted many brilliant mathematicians over the years, including John Maynard Keynes. Their mathematical models of the macro-economy are truly impressive. Unfortunately they are two-dimensional and have not stood up to the test of a multi-dimensional reality. Similar to the risk management models employed until recently by major banks, broker-dealers, and mortgage insurers. The models generally assume that if you pull on one end of a piece of string, the other end will move. Unfortunately the economy is not like that. It is more like a rubber band where you can pull on one end and the other may or may not move, depending on the restraints. This creates the impression that the two are disconnected. But it has created a tension that the market will move to release as soon as the restraint is removed. And, like a rubber band when you release it, the market will not only revert to equilibrium but will overshoot in the other direction. And that, ladies and gentlemen, is a recession.
The study of the economy needs to draw more from the study of herd behavior in evolutionary biology and the field of fluid mechanics in engineering: the study of how liquids and gases move and the forces upon them.
The Big Three
General Motors, Ford and Chrysler are angling for $50 billion in Federal loans. Congress is finding the appeal of saving jobs hard to resist, but the road to hell is paved with good intentions. I believe that they should not receive a cent of taxpayer money. They were the ones who fiddled while Rome burned: selling Hummers while Toyota and Honda developed hybrids. Congress can help, however, by offering rebates to buyers of fuel efficient or alternative energy vehicles; forcing the big three to compete in the open market. Let the buyer decide whether they are worth saving.
Interbank Spreads
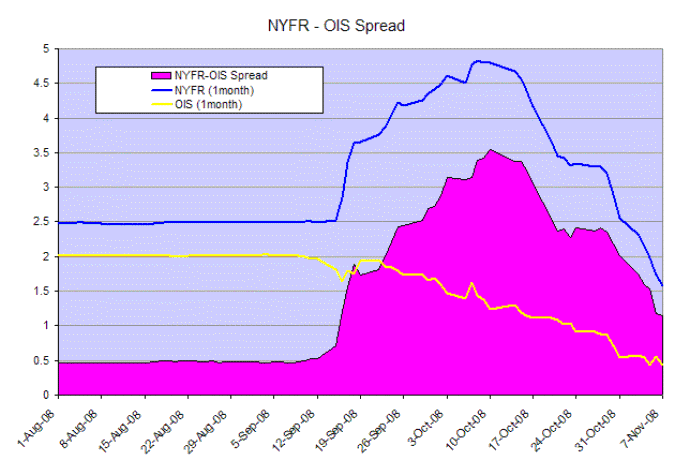
The NYFR-OIS 1-month spread is finally responding, and appears headed for a return to the normal margin of 50 basis points (0.50%). Not unexpected when you consider that the Fed has injected more dollars into the financial system than the annual GDP of a country like Australia. We will have to wait to see the long term impact of such a huge injection of funds.
USA
Dow Jones Industrial Average
The Dow formed an inside day on Friday, signaling uncertainty. Strong volume on Thursday indicates short-term support. Reversal above Thurday's high would indicate a test of resistance at 10000. Breakout below the low would warn of another test of support at 8000.
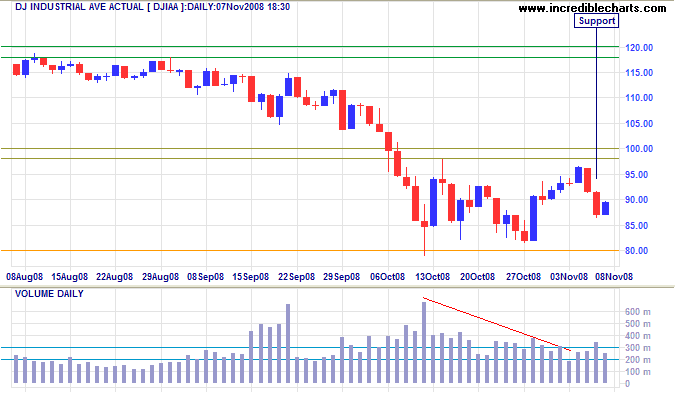
Long Term: The primary trend is down and breakout below 8000 would test the band of support between 7000 and 7300; the 50 percent retracement level for Fibonacci followers. Recovery above 10000 is less likely. And would not signal a primary trend change — unless there is a breakout above primary resistance between 11800 and 12000.
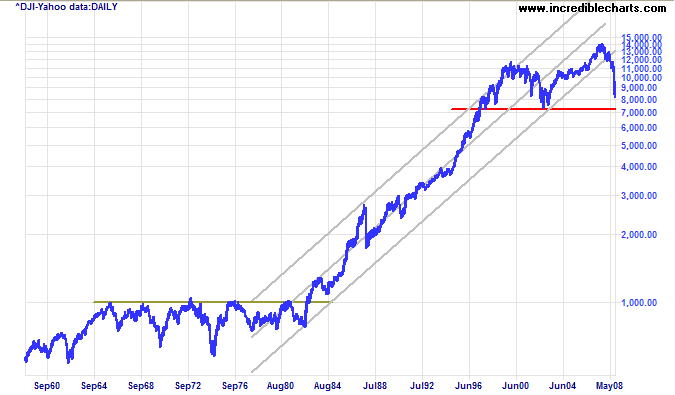
The 50-year chart shows the end of a 30-year bull trend, with a break below the long-term trend channel. Respect of support between 7000 and 7300 would suggest a lengthy period of consolidation, similar to the stagflation of the 1970s. We can be thankful that the man who fixed the stagflation of the 1970s is still around. Our best chance is that Paul Volcker is appointed to an influential position in Treasury or the Fed.
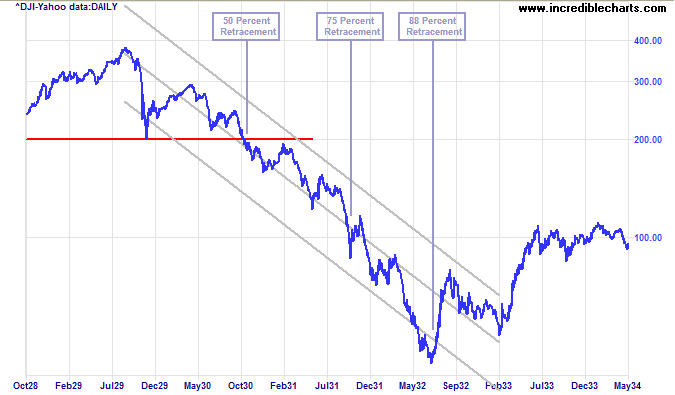
Failure of support at 7000 would warn of a bear trend. The worst case scenario would be a bear trend similar to the early 1930s. The equivalent of a return to the 1987 low, but this remains unlikely at present.
S&P 500
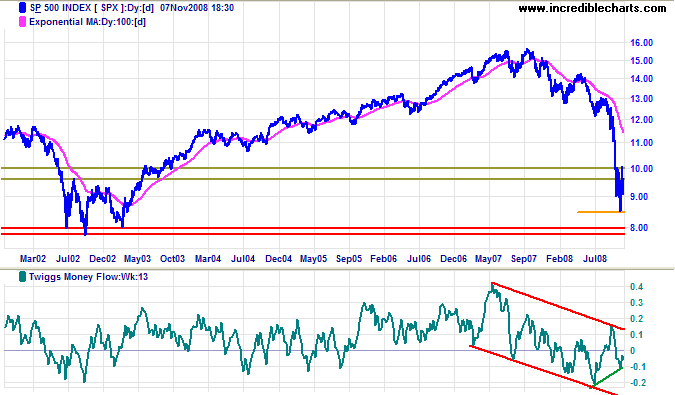
An S&P 500 breakout above 1000 would signal a bear market rally, often referred to as a suckers rally — like the early 1930 rally on the Dow chart above. Reversal below 850 would test the band of support between 780 and 800. Failure of support would warn of a strong bear trend. Twiggs Money Flow (13-week) continues in a downward trend channel. The higher low will only be significant if there is a breakout from the trend channel.
Canada: TSX
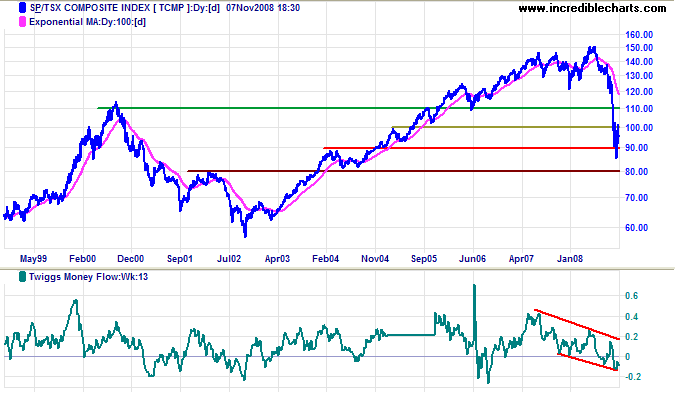
A TSX Composite breakout above 10200 would warn of a similar bear market rally. Reversal below 8600 would test the August 2004 low at 8000. Twiggs Money Flow (13-week) continuing in a downward trend channel signals long-term selling pressure.
United Kingdom: FTSE
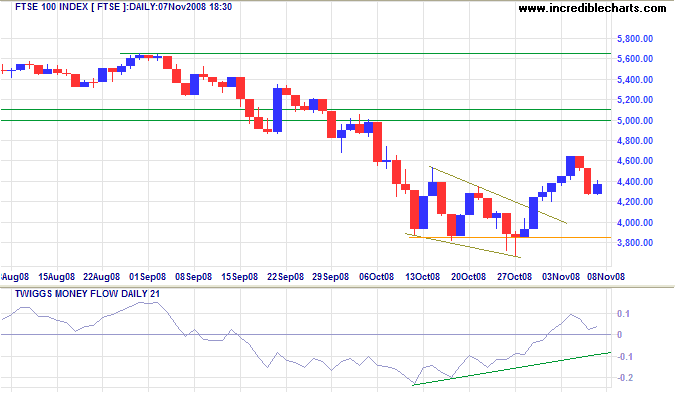
The FTSE 100 broke out above the bullish falling wedge formation, signaling a bear rally. Expect a test of the band of resistance between 5000 and 5100. Reversal below the short-term low of 4250, however, would warn of a test of the October low at 3850. Twiggs Money Flow (21-day) respecting the zero line would confirm medium-term buying pressure. The primary trend is down, however, and reversal below 3850 would test the 2003 low, and 50 percent retracement level, of 3300.
Europe: DAX
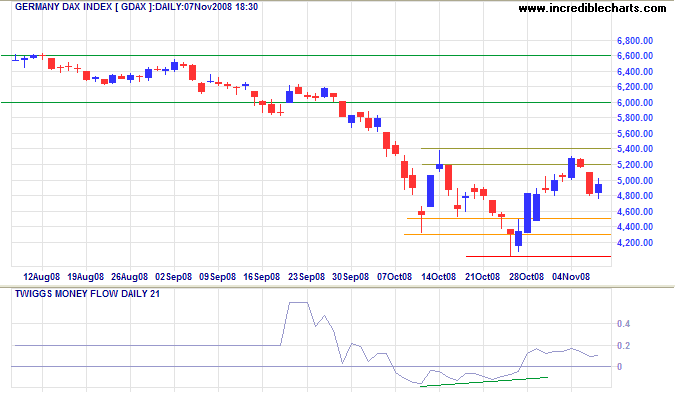
The DAX displays similar hesitation, below the band of resistance between 5200 and 5400. Upward breakout would signal a bear market rally, while reversal below support at 4000 would warn of a test of the August 2004 low of 3600. Twiggs Money Flow (21-Day) respecting the zero line would confirm medium-term buying pressure. The primary trend, however, continues downward.
India: Sensex
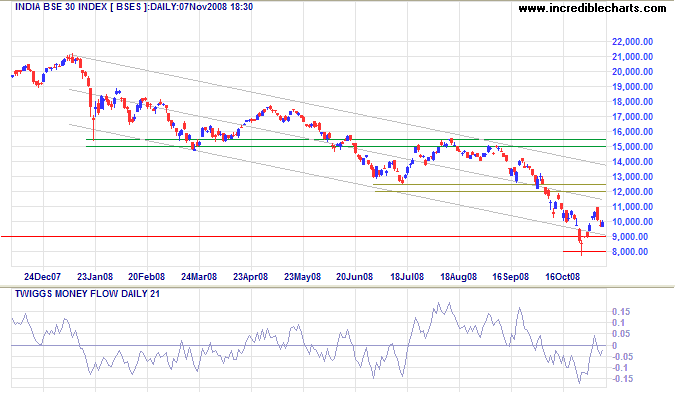
The Sensex rallied before finding resistance at 11000. Twiggs Money Flow (21-Day) below zero signals hesitancy. The primary trend is down and reversal below 8000 would offer a target of 6000, the 2005 low. Breakout above 11000 is less likely and would indicate a test of the upper trend channel.
Japan: Nikkei
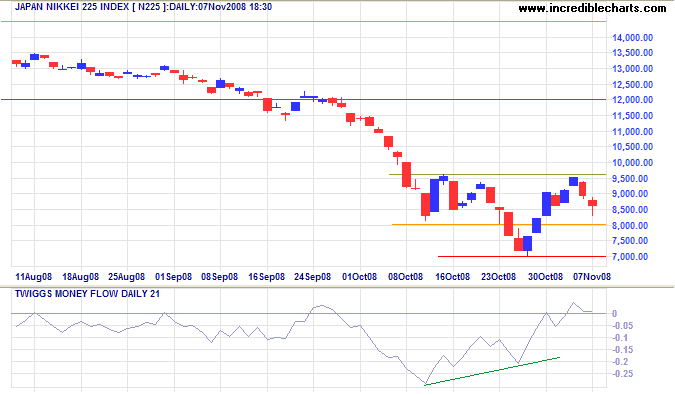
The Nikkei 225 respected resistance at 9500, and is again testing 8000. Reversal above 9500 would complete an inverse head and shoulders, signaling a bear market rally. Failure of support at 7000 would offer a target of 4500, calculated as 7000 - ( 9500 - 7000 ). Twiggs Money Flow (21-Day) holding above the zero line would signal short-term buying pressure
China
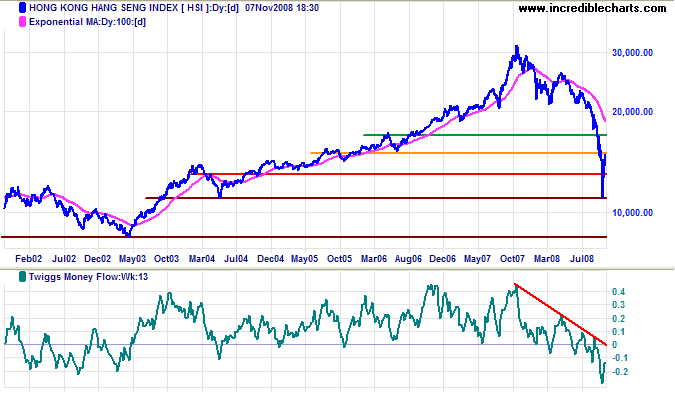
The Hang Seng is headed for another test of resistance at 15000 after rebounding off support at 11000. Breakout above 15000 would signal a bear market rally. The primary trend is down, however, and Twiggs Money Flow (13-Week) indicates long-term selling pressure. Reversal below 11000 would offer a target of 8500, the 2003 low.
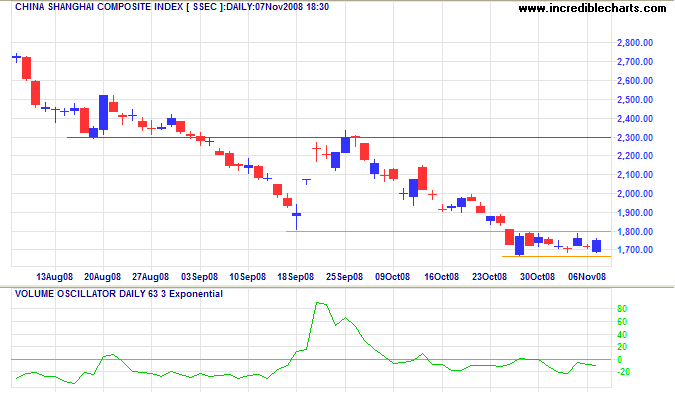
The Shanghai Composite displays a narrow rectangular consolidation and low volume, indicating continuation of the down-trend. The primary target is the August 2006 low of 1500 — a 75 percent retracement. With most of their global customers entering a recession, China's export-led economy is likely to follow.
Australia: ASX
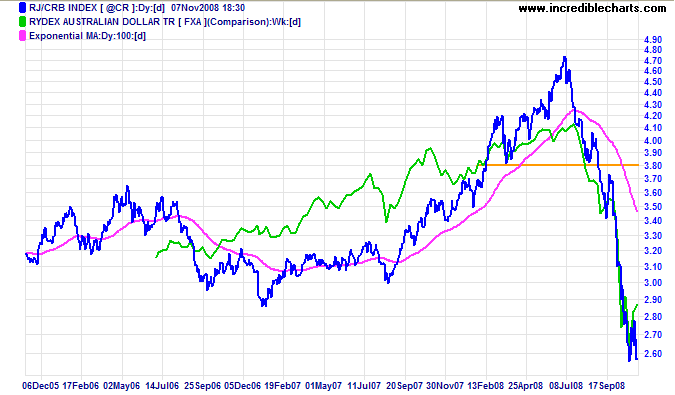
The CRB commodities index continues downward, indicating further weakness in the ASX and the Australian dollar. The Treasurer's recently announced $40 billion hole in the budget surplus may just be the start.
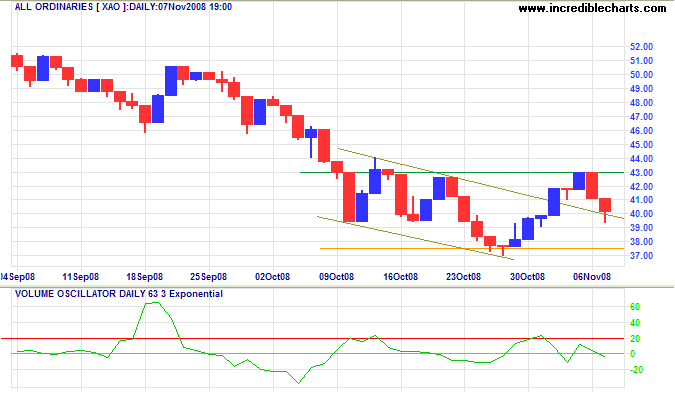
The All Ordinaries encountered resistance at 4300 and now appears headed for a test of 3750. Low volume indicates minimal buying pressure. Flags in the direction of the trend are less common than flags that slope against the trend — and are less reliable according to Thomas Bulkowski.
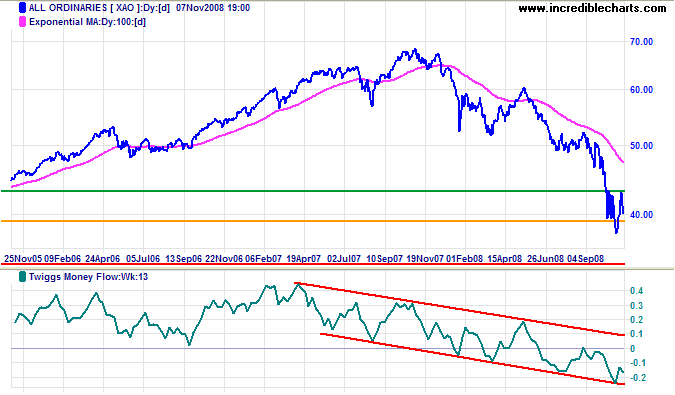
Long Term: The prospects of the mining sector are dependent on demand from China and India, while the property, construction and banking sector is likely to suffer further negative effects from the global credit contraction. Twiggs Money Flow (13-week) index continues in a strong downward trend channel. Failure of support at 3750 would test the 50 percent retracement level at 3400.
Thomas Jefferson once said, "We should never judge a president by his age, only by his works."
And ever since he told me that, I stopped worrying.
~ Ronald Reagan
